Browse every indexed city profile and compare structured indicators across affordability, air quality, energy readiness, resilience, public safety, healthcare, and transport. All city links are server-rendered and crawlable.
Cities indexed
2369
Countries covered
100
Last updated
2026-05-16
Data year
2025
Featured cities
A featured selection of city profiles. The complete, crawlable index of every indexed city is in the “Cities by country” section below.
Use the Norfolk profile to compare housing, air quality, and resilience dimensions alongside regional peers such as virginia-beach, richmond, and washington-dc.
Use the Durham profile to compare affordability, air quality, and energy dimensions alongside regional peers such as raleigh, charlotte, and greensboro.
Use the Lincoln profile to compare affordability, energy, and resilience dimensions alongside regional peers such as omaha, des-moines, and kansas-city.
Use the West Palm Beach profile to compare affordability, air quality, and resilience dimensions alongside regional peers such as miami, fort-lauderdale, and cape-coral.
Use the Clearwater profile to compare affordability, air quality, and resilience dimensions alongside regional peers such as tampa, st-petersburg, and cape-coral.
Use the Sarasota profile to compare affordability, air quality, and resilience dimensions alongside regional peers such as tampa, cape-coral, and st-petersburg.
Use the Fort Myers profile to compare affordability, air quality, and resilience dimensions alongside regional peers such as cape-coral, north-port, and tampa.
Use the Myrtle Beach profile to compare affordability, air quality, and resilience dimensions alongside regional peers such as charleston, columbia, and wilmington-nc.
Use the Clarksville profile to compare affordability, energy, and resilience dimensions alongside regional peers such as nashville, knoxville, and chattanooga.
Use the Harrisburg profile to compare affordability, air quality, and energy dimensions alongside regional peers such as philadelphia, pittsburgh, and allentown.
Use the Albany profile to compare affordability, air quality, and resilience dimensions alongside regional peers such as new-york, boston, and buffalo.
Use the College Station profile to compare affordability, energy, and resilience dimensions alongside regional peers such as austin, houston, and waco.
Use the St. Augustine profile to compare affordability, air quality, and resilience dimensions alongside regional peers such as jacksonville, orlando, and tallahassee.
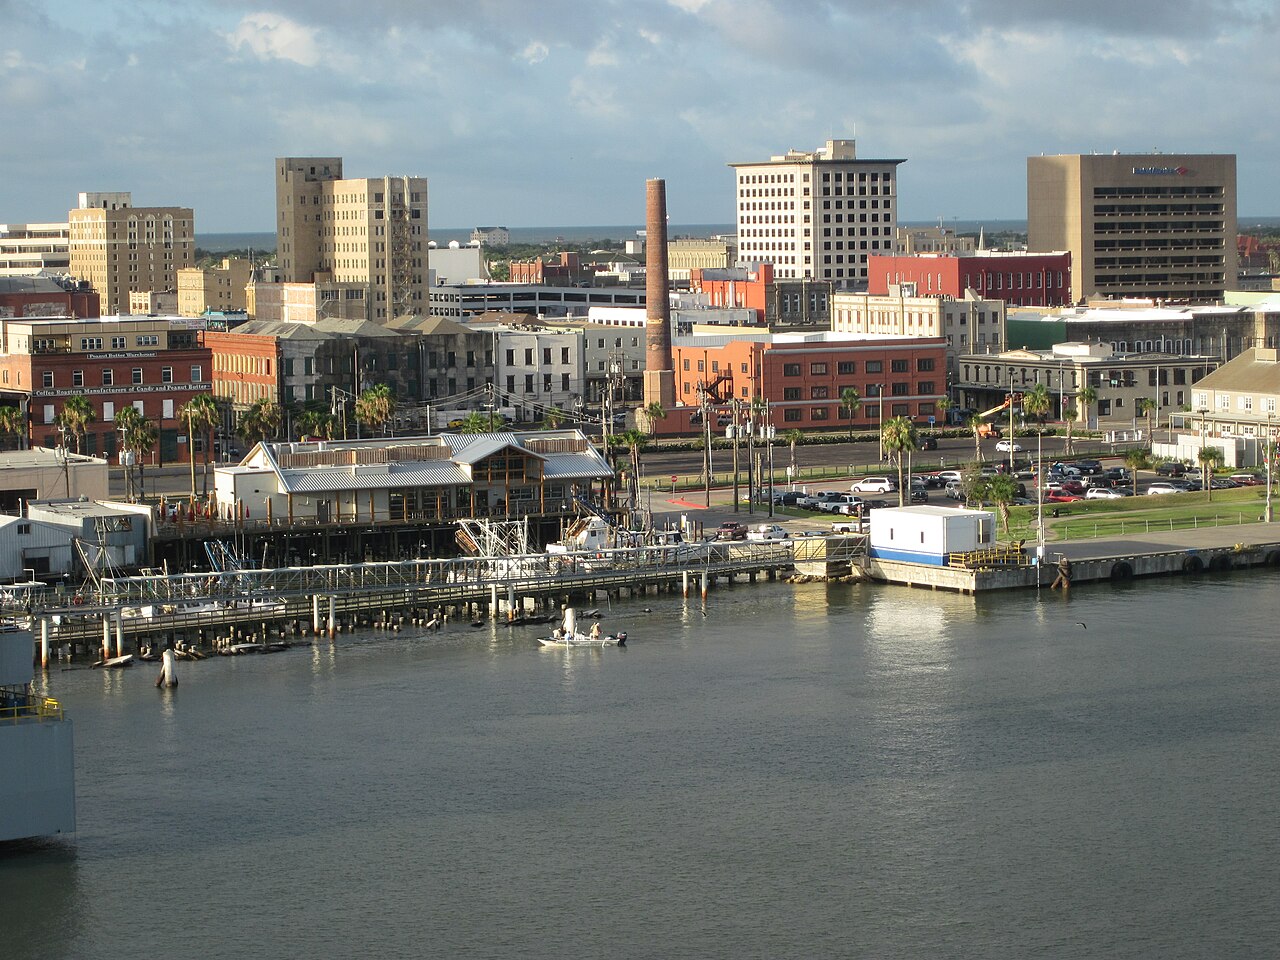
Use the Galveston profile to compare affordability, air quality, and resilience dimensions alongside regional peers such as houston, corpus-christi, and dallas.
Use the Jackson profile to compare affordability, air quality, and resilience dimensions alongside regional peers such as bozeman, missoula, and boise.
Use the Manchester profile to compare affordability, air quality, and energy dimensions alongside regional peers such as boston, providence, and hartford.
Use the Portland profile to compare affordability, air quality, and resilience dimensions alongside regional peers such as boston, providence, and burlington-vt.
Use the Murfreesboro profile to compare affordability, energy, and resilience dimensions alongside regional peers such as nashville, knoxville, and chattanooga.
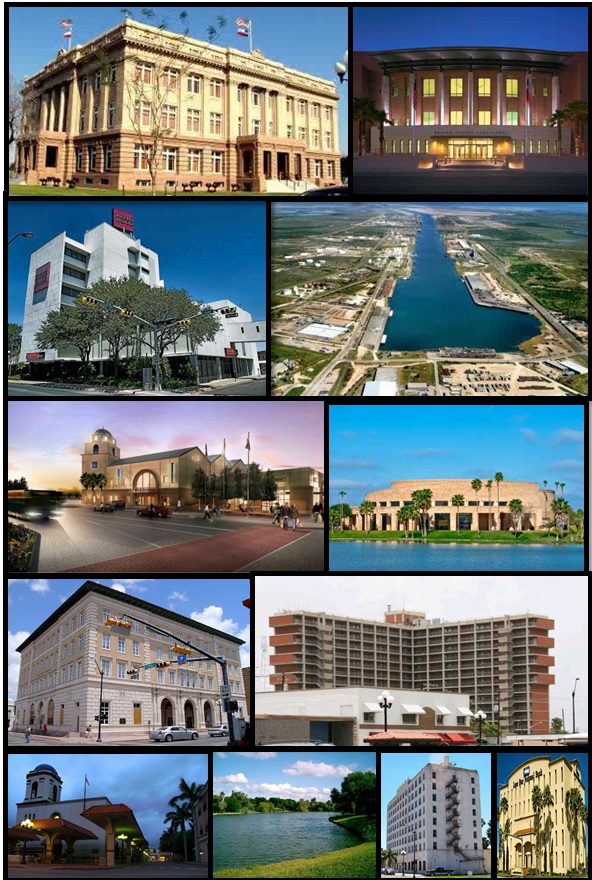
Use the Brownsville profile to compare affordability, energy, and resilience dimensions alongside regional peers such as mcallen, corpus-christi, and san-antonio.
Use the Coeur d'Alene profile to compare affordability, air quality, and resilience dimensions alongside regional peers such as spokane, boise, and missoula.
Use the Trenton profile to compare affordability, air quality, and energy dimensions alongside regional peers such as philadelphia, newark, and new-york.
Overall55/100
Image credit: Image: Flickr user: high limitzz https://www.flickr.com/people/highlimitstudio/ / Wikimedia Commons, CC BY 2.0
Use the Annapolis profile to compare affordability, air quality, and resilience dimensions alongside regional peers such as baltimore, washington-dc, and richmond.
Use the Frederick profile to compare affordability, air quality, and resilience dimensions alongside regional peers such as washington-dc, baltimore, and richmond.
Use the Gainesville profile to compare affordability, air quality, and energy dimensions alongside regional peers such as orlando, jacksonville, and tampa.
Use the Rochester profile to compare affordability, air quality, and resilience dimensions alongside regional peers such as minneapolis, des-moines, and madison.
Use the Melbourne profile to compare affordability, air quality, and resilience dimensions alongside regional peers such as orlando, jacksonville, and tampa.
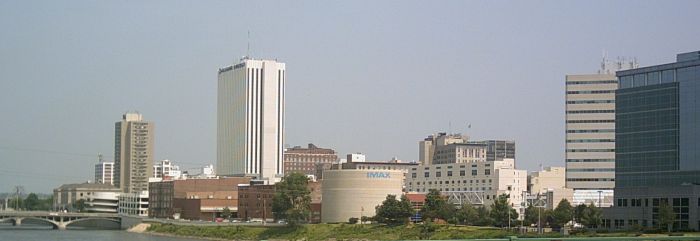
Use the Cedar Rapids profile to compare affordability, energy, and resilience dimensions alongside regional peers such as des-moines, iowa-city, and omaha.
Use the Cheyenne profile to compare affordability, energy, and resilience dimensions alongside regional peers such as fort-collins, denver, and colorado-springs.
Use the Naples profile to compare affordability, air quality, and resilience dimensions alongside regional peers such as cape-coral, fort-myers, and north-port.
Each city profile combines structured indicators (affordability, air quality, energy, resilience), source-attributed verified layers (emergency contacts, healthcare access, transport authorities where available), and crawlable internal links to module and ranking pages. Indicators are directional; for critical decisions, follow the official source links cited on each page.
Cost of living calculator — planning a move or longer stay? Use your own budget inputs to compare monthly costs between cities. Not an official cost-of-living measurement.
Travel budget calculator — planning a visit or shorter stay? Use your own trip inputs to estimate accommodation, food, transport, activities, travel, and emergency buffer. Not an official travel cost estimate.