Supported cities
74
City profiles indexed for Canada.
North America
Canada's profile combines strong public services, low-carbon electricity in many provinces, and rising housing-cost pressure in major cities. Canada is indexed at the country level in North America, with 74 city profiles linked below.

Image credit: Image: NASA / Wikimedia Commons, Public domain
Additional verified imagery for Canada. Each photo is sourced from Wikimedia Commons with full attribution and a permissive license.

Banff National Park
Image credit: Image: Gorgo / Wikimedia Commons, Public domain
Snapshot of structured Canada city intelligence and which verified utility layers are available on this hub.
Supported cities
74
City profiles indexed for Canada.
Emergency profile
Verified
Country emergency contacts attributed to official publishers.
Healthcare profile
Verified
Healthcare layer attributed to official health authorities.
Transport profile
Verified
Transport authority and operator references attributed to official sources.
Related comparisons
5
Curated city-vs-city comparison pages that reference this country.
Related collections
4
Best Cities collections that include at least one city from this country.
Data year
2025
Reference year for the country intelligence dataset.
Last updated
2026-05-16
Most recent platform-side review of the country hub.
High
Public health and education services support strong daily life.
Favorable grid
Low-carbon electricity in major provinces supports city-level transition.
High
Housing-cost pressure is the main resident well-being constraint in major cities.
Country pages group cities into crawlable clusters and give national context without replacing city-level comparisons.
| Metric | Value | Context |
|---|---|---|
| Region | North America | Used for geographic clustering and regional comparisons. |
| Indexed cities | 74 | Niagara Falls, Fredericton, Red Deer, Sault Ste. Marie, Banff, Sarnia, Cornwall, Vernon, Penticton, Medicine Hat, London, St. Catharines, Guelph, Moncton, Brantford, Saint John, Lethbridge, Peterborough, Chilliwack, Belleville, Oshawa, Barrie, Abbotsford, Saguenay, Kingston, Trois-Rivières, Mississauga, Brampton, Surrey, Laval, Markham, Vaughan, Burnaby, Longueuil, Toronto, Vancouver, Montreal, Calgary, Ottawa, Quebec City, Edmonton, Winnipeg, Halifax, Victoria, Saskatoon, Waterloo, Kelowna, Regina, Hamilton, St. John's, Charlottetown, Thunder Bay, Gatineau, Windsor, Kitchener, Sherbrooke, Nanaimo, Kamloops, Prince George, Yellowknife, Whitehorse, Greater Sudbury, Richmond Hill, Burlington, Lévis, Coquitlam, Terrebonne, Delta, Chatham-Kent, Pickering, Dartmouth, Maple Ridge, Kawartha Lakes, Airdrie |
| Service depth | High | Public health and education services support strong daily life. |
| Energy transition context | Favorable grid | Low-carbon electricity in major provinces supports city-level transition. |
| Affordability pressure | High | Housing-cost pressure is the main resident well-being constraint in major cities. |
Each linked city page includes its own metadata, data table, source block, module links, and any verified utility layers.

Image credit: Image: Jason Pratt / Wikimedia Commons, CC BY 2.0
Canada / North America
Use the Niagara Falls profile to compare affordability, air quality, and energy alongside Toronto, Hamilton, and St. Catharines.

Image credit: Image: New Brunswick / Nouveau-Brunswick / Wikimedia Commons, CC0
Canada / North America
Use the Fredericton profile to compare affordability, air quality, and resilience alongside Halifax, Saint John, and Moncton.

Image credit: Image: Otto.blinken / Wikimedia Commons, CC BY-SA 4.0
Canada / North America
Use the Red Deer profile to compare affordability, energy, and resilience alongside Calgary, Edmonton, and Lethbridge.

Image credit: Image: Andre Carrotflower / Wikimedia Commons, CC BY-SA 4.0
Canada / North America
Use the Sault Ste. Marie profile to compare affordability, air quality, and resilience alongside Thunder Bay, Greater Sudbury, and Toronto.

Image credit: Image: Port(u*o)s / Wikimedia Commons, CC BY 2.5
Canada / North America
Use the Banff profile to compare affordability, air quality, and resilience alongside Calgary, Kelowna, and Edmonton.

Image credit: Image: P199 / Wikimedia Commons, CC BY-SA 3.0
Canada / North America
Use the Sarnia profile to compare affordability, air quality, and energy alongside Windsor, London, and Hamilton.

Image credit: Image: P199 / Wikimedia Commons, CC BY-SA 3.0
Canada / North America
Use the Cornwall profile to compare affordability, air quality, and resilience alongside Ottawa, Kingston, and Montreal.

Image credit: Image: cogdogblog / Wikimedia Commons, CC BY 2.0
Canada / North America
Use the Vernon profile to compare affordability, air quality, and resilience alongside Kelowna, Kamloops, and Vancouver.

Image credit: Image: Blake Handley from Victoria, Canada / Wikimedia Commons, CC BY 2.0
Canada / North America
Use the Penticton profile to compare affordability, air quality, and resilience alongside Kelowna, Kamloops, and Victoria.

Image credit: Image: Festbock / Wikimedia Commons, CC BY-SA 3.0
Canada / North America
Use the Medicine Hat profile to compare affordability, energy, and resilience alongside Calgary, Lethbridge, and Regina.

Image credit: Image: InvisPerson5009 / Wikimedia Commons, CC BY-SA 4.0
Canada / North America
Use the London profile to compare cost framing, healthcare framing, and transport access alongside Kitchener and other Ontario peers.

Image credit: Image: Shawn Kent from Halifax, NS, Canada / Wikimedia Commons, CC BY 2.0
Canada / North America
Use the St. Catharines profile to compare cost framing, transport access, and country-level healthcare context alongside Hamilton and other Ontario peers.

Image credit: Image: Patty O'Hearn Kickham from Guelph, Ontario, Canada / Wikimedia Commons, CC BY 2.0
Canada / North America
Use the Guelph profile to compare cost framing, transport access, and healthcare framing alongside Kitchener and other Ontario peers.

Image credit: Image: James Mann from Moncton, New Brunswick, Canada / Wikimedia Commons, CC BY 2.0
Canada / North America
Use the Moncton profile to compare cost framing, transport access, and country-level healthcare context alongside Halifax and other Atlantic Canada peers.

Image credit: Image: JFVoll / Wikimedia Commons, CC BY-SA 4.0
Canada / North America
Use the Brantford profile to compare cost framing, transport access, and healthcare framing alongside Hamilton and other Ontario peers.

Image credit: Image: Quintin Soloviev / Wikimedia Commons, CC BY 4.0
Canada / North America
Use the Saint John profile to compare cost framing, energy context, and country-level healthcare framing alongside Halifax and other Atlantic Canada peers.

Image credit: Image: dave_7 from Canada / Wikimedia Commons, CC BY 2.0
Canada / North America
Use the Lethbridge profile to compare cost framing, energy context, and country-level healthcare framing alongside Calgary and other prairie peers.

Image credit: Image: Jkentrandall / Wikimedia Commons, CC BY-SA 3.0
Canada / North America
Use the Peterborough profile to compare cost framing, transport access, and healthcare framing alongside Oshawa and other Ontario peers.

Image credit: Image: Dan Lengkeek / Wikimedia Commons, CC BY 3.0
Canada / North America
Use the Chilliwack profile to compare cost framing, transport access, and climate-resilience context alongside Abbotsford and other British Columbia peers.

Image credit: Image: P199 / Wikimedia Commons, CC BY-SA 3.0
Canada / North America
Use the Belleville profile to compare cost framing, transport access, and healthcare framing alongside Kingston and other Ontario peers.

Image credit: Image: P199 / Wikimedia Commons, CC BY-SA 3.0
Canada / North America
Use the Oshawa profile to compare cost framing, transport access, and country-level healthcare context alongside Toronto and other Ontario peers.

Image credit: Image: Ryan Tir / Wikimedia Commons, CC BY 2.0
Canada / North America
Use the Barrie profile to compare cost framing, transport access, and relocation framing alongside Toronto and other Ontario peers.

Image credit: Image: Urban Walnut / Wikimedia Commons, CC BY-SA 3.0
Canada / North America
Use the Abbotsford profile to compare cost framing, transport access, and climate-resilience context alongside Vancouver and other British Columbia peers.

Image credit: Image: MicThibeault / Wikimedia Commons, CC BY-SA 4.0
Canada / North America
Use the Saguenay profile to compare cost framing, energy context, and country-level healthcare framing alongside Quebec City and Sherbrooke.

Image credit: Image: atomboy / Wikimedia Commons, CC BY 3.0
Canada / North America
Use the Kingston profile to compare cost framing, healthcare framing, and transport access alongside Ottawa and other Ontario peers.

Image credit: Image: Fralambert / Wikimedia Commons, CC BY-SA 3.0
Canada / North America
Use the Trois-Rivieres profile to compare cost framing, transport access, and country-level healthcare context alongside Quebec City and Sherbrooke.

Image credit: Image: Nick de Guzman / Wikimedia Commons, CC BY 2.0
Canada / North America
Use the Mississauga profile to compare cost framing, transport access, and healthcare framing alongside Toronto, Hamilton, and Ottawa.

Image credit: Image: Trappy (talk)Trappy. Trappy at English Wikipedia / Wikimedia Commons, CC BY-SA 3.0
Canada / North America
Use the Brampton profile to compare cost framing, transport access, and relocation framing alongside Toronto, Hamilton, and Ottawa.

Image credit: Image: Northwest / Wikimedia Commons, CC BY 4.0
Canada / North America
Use the Surrey profile to compare cost framing, transport access, and healthcare framing alongside Vancouver, Victoria, and Kelowna.

Image credit: Image: Mario Hains / Wikimedia Commons, CC BY-SA 3.0
Canada / North America
Use the Laval profile to compare cost framing, transport access, and energy context alongside Montreal, Quebec City, and Ottawa.

Image credit: Image: Raysonho @ Open Grid Scheduler / Grid Engine / Wikimedia Commons, CC0
Canada / North America
Use the Markham profile to compare cost framing, transport access, and relocation framing alongside Toronto, Waterloo, and Ottawa.

Image credit: Image: Loozrboy / Wikimedia Commons, CC BY-SA 2.0
Canada / North America
Use the Vaughan profile to compare cost framing, transport access, and relocation framing alongside Toronto, Hamilton, and Ottawa.

Image credit: Image: Vranak / Wikimedia Commons, CC BY-SA 3.0
Canada / North America
Use the Burnaby profile to compare cost framing, transport access, and energy context alongside Vancouver, Victoria, and Kelowna.

Image credit: Image: User:Gene.arboit / Wikimedia Commons, CC BY-SA 3.0
Canada / North America
Use the Longueuil profile to compare cost framing, transport access, and energy context alongside Montreal, Quebec City, and Ottawa.

Image credit: Image: Jchmrt / Wikimedia Commons, CC BY-SA 4.0
Canada / North America
Toronto is most informative for users comparing North-American services and transit reach against rising housing pressure and winter resilience.

Image credit: Image: Northwest / Wikimedia Commons, CC BY 4.0
Canada / North America
Vancouver is most useful for users comparing outdoor amenity, clean-energy direction, and tech-sector growth against high housing pressure.
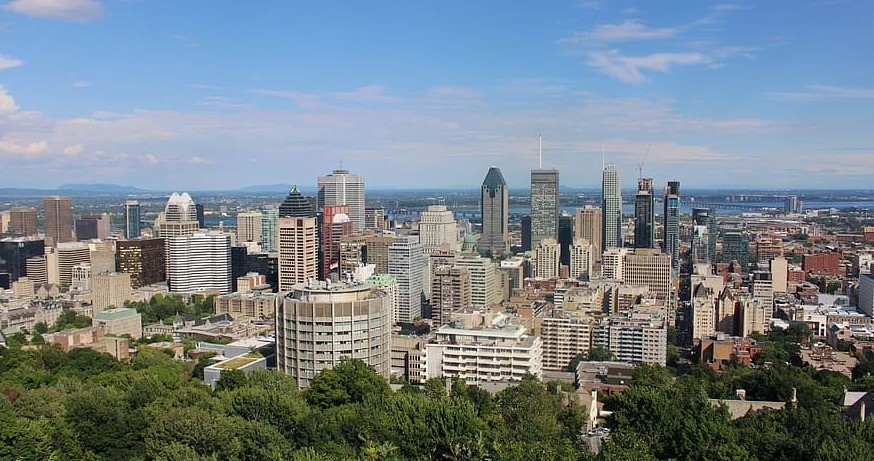
Image credit: Image: https://www.pxfuel.com/ / Wikimedia Commons, CC0
Canada / North America
Use the Montreal profile to compare cost framing, transport access, healthcare framing, and country-level context alongside Toronto and Vancouver.

Image credit: Image: Gorgo / Wikimedia Commons, Public domain
Canada / North America
Use the Calgary profile to compare cost framing, country-level healthcare and transport context, and relocation framing alongside Toronto and Vancouver.

Image credit: Image: David Samuel, User:Hellodavey1902 / Wikimedia Commons, CC BY-SA 3.0
Canada / North America
Use the Ottawa profile to compare cost framing, mobility, and public-services signals alongside Toronto and Montreal.

Image credit: Image: Fabian Roudra Baroi / Wikimedia Commons, CC BY-SA 4.0
Canada / North America
Use the Quebec City profile to compare cost framing, transport access, and country-level context alongside Montreal and other Canadian metros.

Image credit: Image: IQRemix / Wikimedia Commons, CC BY-SA 2.0
Canada / North America
Use the Edmonton profile to compare cost framing, transport access, and country-level context alongside Calgary, Winnipeg, and other Canadian metros.

Image credit: Image: Quintin Soloviev / Wikimedia Commons, CC0
Canada / North America
Use the Winnipeg profile to compare cost framing, transport access, and country-level intelligence alongside Edmonton, Saskatoon, and other Canadian metros.

Image credit: Image: WayeMason / Wikimedia Commons, CC BY-SA 3.0
Canada / North America
Use the Halifax profile to compare cost framing, transport access, and coastal-resilience signals alongside other Atlantic-Canadian and US metros.

Image credit: Image: Buiobuione / Wikimedia Commons, CC BY-SA 4.0
Canada / North America
Use the Victoria profile to compare cost framing, transport access, and country-level context alongside Vancouver and Seattle.

Image credit: Image: Joli Rumi / Wikimedia Commons, CC BY-SA 4.0
Canada / North America
Use the Saskatoon profile to compare cost framing, transport access, and country-level Canadian Prairie context alongside Edmonton and Winnipeg.

Image credit: Image: Giligone / Wikimedia Commons, CC BY-SA 3.0
Canada / North America
Use the Waterloo profile to compare cost framing, transport access, and country-level context alongside Toronto and Ottawa.

Image credit: Image: Darren Kirby (bulliver) / Wikimedia Commons, CC BY-SA 2.0
Canada / North America
Use the Kelowna profile to compare cost framing, transport access, and country-level context alongside Vancouver and Victoria.

Image credit: Image: 28thegreat / Wikimedia Commons, CC BY-SA 4.0
Canada / Saskatchewan
Use this record as a regional planning anchor while deeper source integration is pending. Verify access, transport, and seasonal context with official sources before relying on the page for travel decisions.

Image credit: Image: Nhl4hamilton (Rick Cordeiro) / Wikimedia Commons, Public domain
Canada / Ontario
Use this record as a planning anchor for local-first research and nearby weekend-rest discovery, verifying access, transport, and seasonal context with official sources.

Image credit: Image: Judicieux / Wikimedia Commons, CC BY-SA 4.0
Canada / Newfoundland and Labrador
Use this record as a planning anchor for local-first research and nearby weekend-rest discovery, verifying access, transport, and seasonal context with official sources.

Image credit: Image: Martin Cathrae from Charlottetown, PE, Canada / Wikimedia Commons, CC BY-SA 2.0
Canada / Prince Edward Island
Use this record as a planning anchor for local-first research and nearby weekend-rest discovery, verifying access, transport, and seasonal context with official sources.

Image credit: Image: P199 / Wikimedia Commons, CC BY-SA 3.0
Canada / Ontario
Use this record as a planning anchor for local-first research and nearby weekend-rest discovery, verifying access, transport, and seasonal context with official sources.
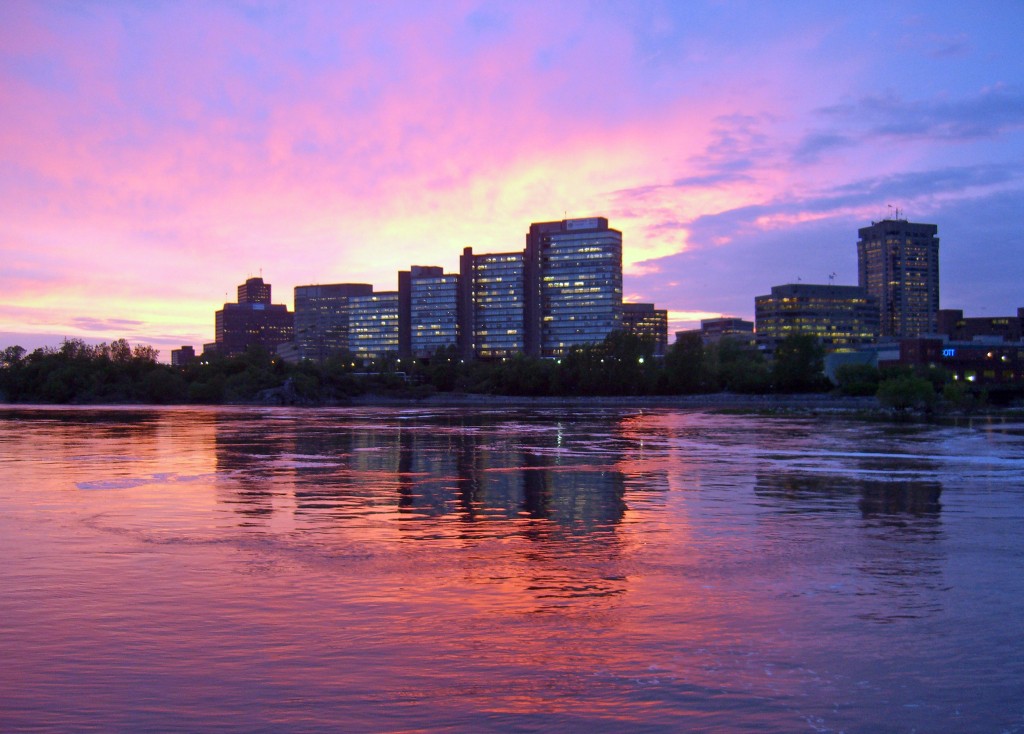
Image credit: Image: No machine-readable author provided. Adam the atom assumed (based on copyright claims). / Wikimedia Commons, CC BY-SA 3.0
Canada / Quebec
Use this record as a planning anchor for local-first research and nearby weekend-rest discovery, verifying access, transport, and seasonal context with official sources.

Image credit: Image: WMrapids / Wikimedia Commons, CC0
Canada / Ontario
Use this record as a planning anchor for local-first research and nearby weekend-rest discovery, verifying access, transport, and seasonal context with official sources.

Image credit: Image: JustSomePics / Wikimedia Commons, CC BY-SA 4.0
Canada / Ontario
Use this record as a planning anchor for local-first research and nearby weekend-rest discovery, verifying access, transport, and seasonal context with official sources.

Image credit: Image: Lëa-Kim Châteauneuf / Wikimedia Commons, CC BY-SA 4.0
Canada / Quebec
Use this record as a planning anchor for local-first research and nearby weekend-rest discovery, verifying access, transport, and seasonal context with official sources.

Image credit: Image: Braveheart / Wikimedia Commons, Public domain
Canada / British Columbia
Use Nanaimo as a planning anchor for local-first research and nearby weekend-rest discovery, confirming ferry schedules, road access, and seasonal details with official sources.

Image credit: Image: Chensiyuan / Wikimedia Commons, CC BY-SA 3.0
Canada / British Columbia
Treat Kamloops as a planning anchor for local-first research and nearby weekend-rest discovery, verifying trail access, road and rail connections, and seasonal details with official sources.

Image credit: Image: Iranianson / Wikimedia Commons, CC BY-SA 3.0
Canada / British Columbia
Use Prince George as a planning anchor for local-first research and nearby weekend-rest discovery, confirming road access, services, and seasonal details with official sources.
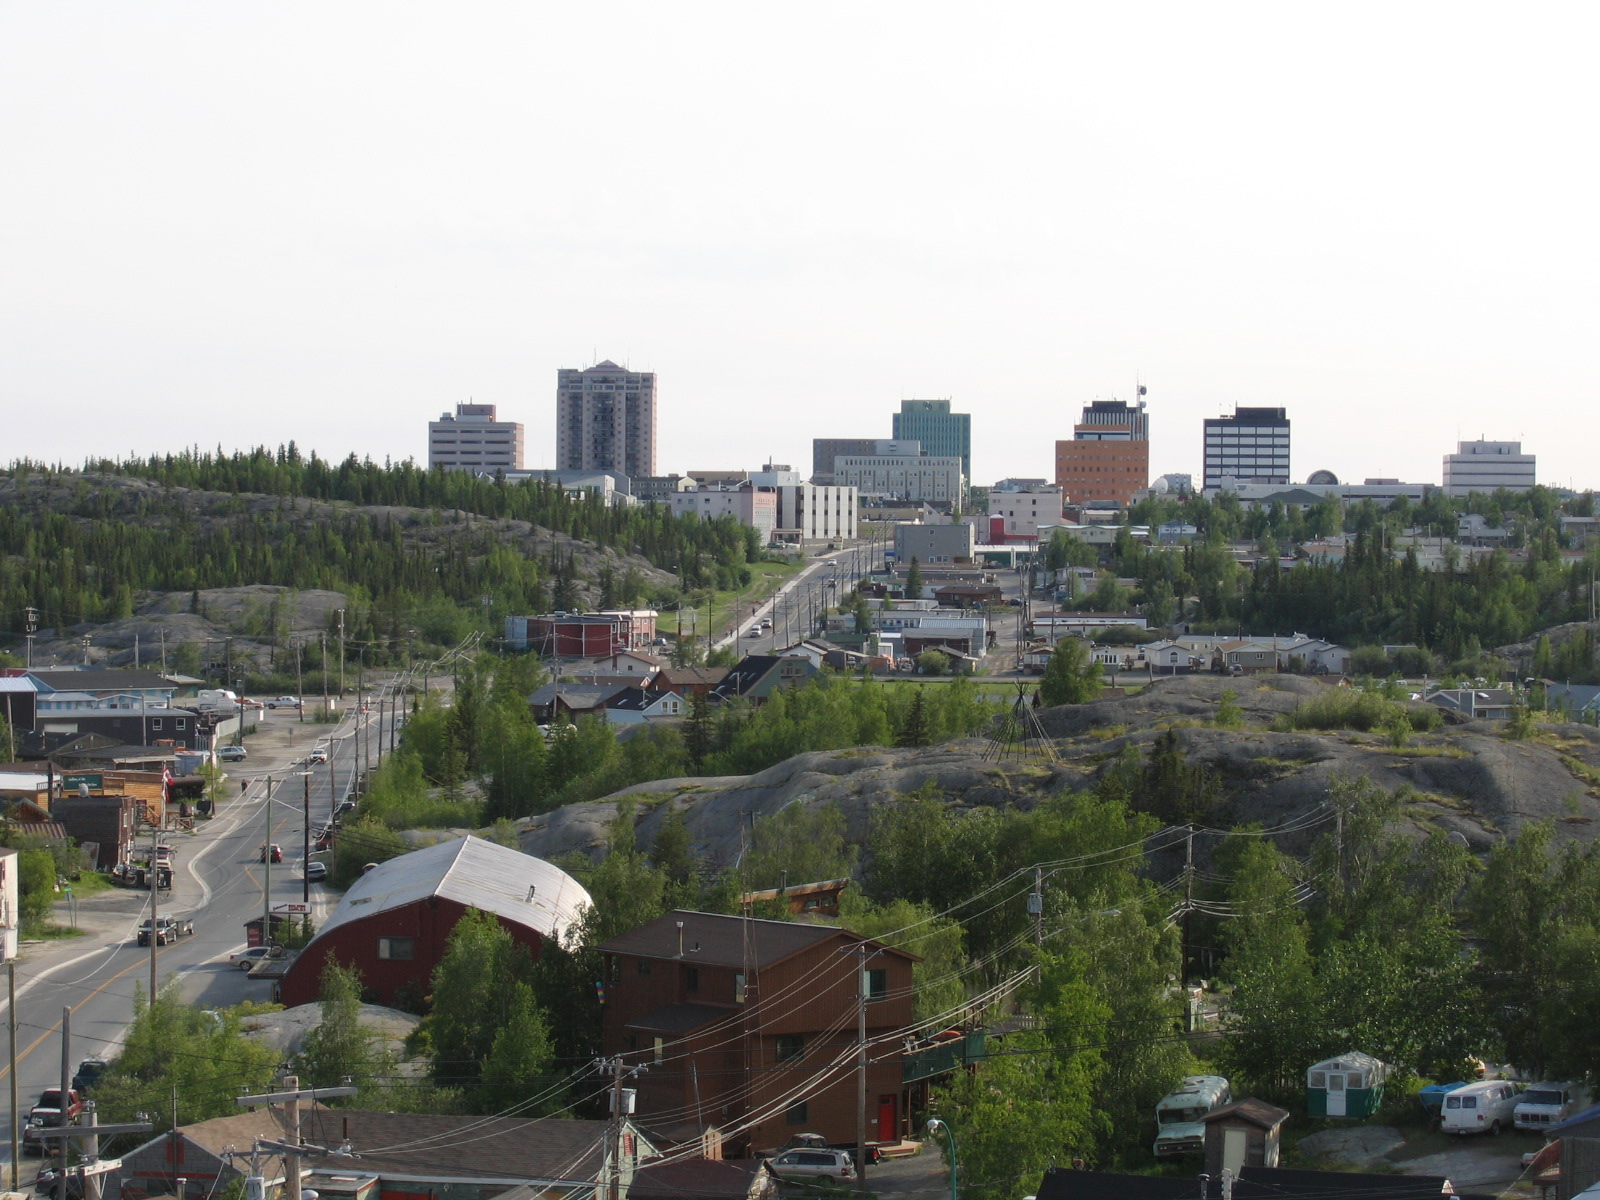
Image credit: Image: User:Trevor MacInnis / Wikimedia Commons, Public domain
Canada / Northwest Territories
Approach Yellowknife as a planning anchor for local-first research and nearby weekend-rest discovery, carefully verifying access, transport, daylight, and seasonal conditions with official sources.

Image credit: Image: Louis White / Wikimedia Commons, CC BY-SA 2.0
Canada / Yukon
Use Whitehorse as a planning anchor for local-first research and nearby weekend-rest discovery, confirming highway access, transport, daylight, and seasonal conditions with official sources.
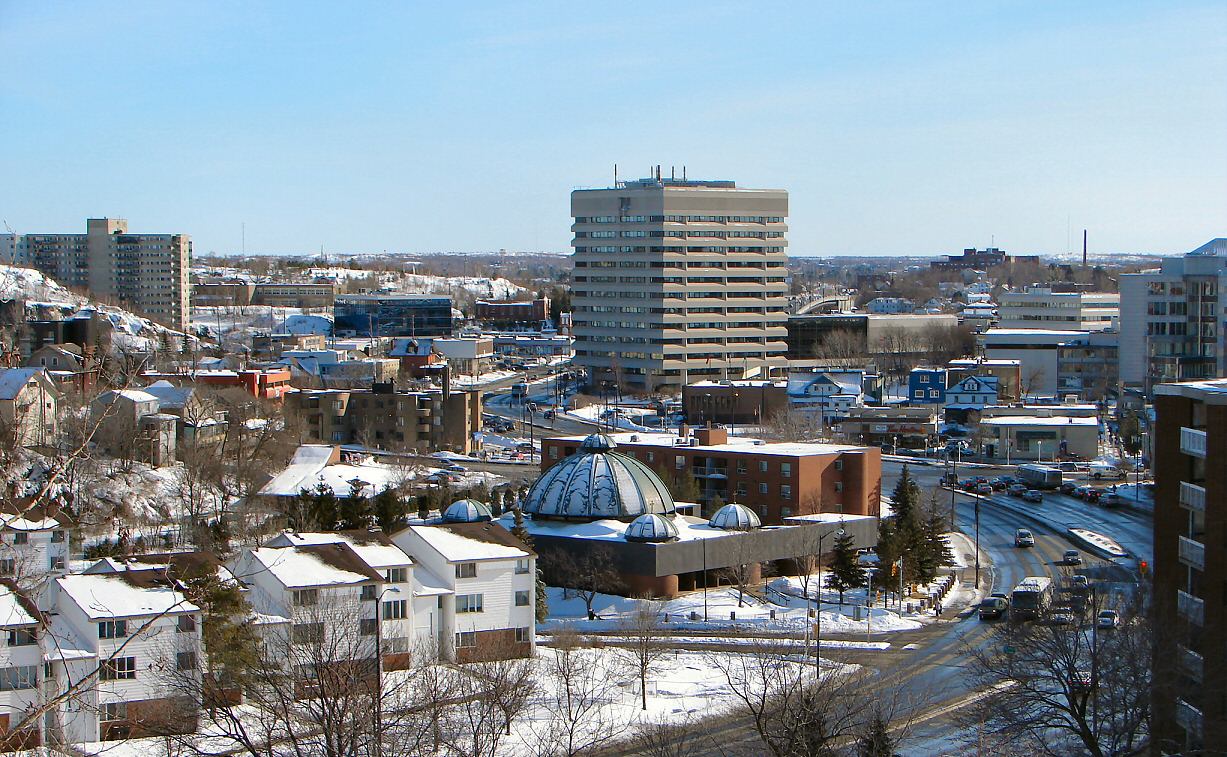
Image credit: Image: P199 / Wikimedia Commons, CC BY-SA 4.0
Canada / Ontario
Treat Greater Sudbury as a planning anchor for local-first research and nearby weekend-rest discovery, verifying access, transport, and seasonal details with official sources.

Image credit: Image: CCC2012 / Wikimedia Commons, CC0
Canada / North America
Use the Richmond Hill profile to compare affordability, livability, and economic indicators against other indexed cities in Canada and across North America, and to explore nearby nature and weekend destinations.

Image credit: Image: Canmenwalker / Wikimedia Commons, CC BY 4.0
Canada / North America
Use the Burlington profile to compare affordability, livability, and economic indicators against other indexed cities in Canada and across North America, and to explore nearby nature and weekend destinations.

Image credit: Image: Harfang / Wikimedia Commons, CC BY-SA 3.0
Canada / North America
Use the Lévis profile to compare affordability, livability, and economic indicators against other indexed cities in Canada and across North America, and to explore nearby nature and weekend destinations.
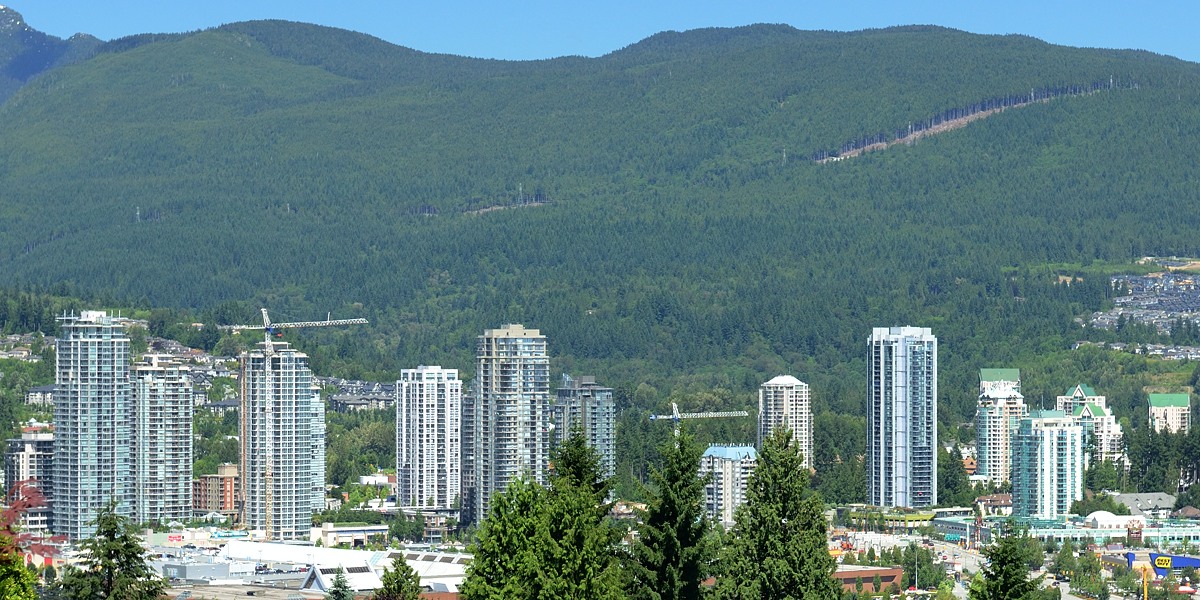
Image credit: Image: Greg Salter / Wikimedia Commons, CC BY-SA 3.0
Canada / North America
Use the Coquitlam profile to compare affordability, livability, and economic indicators against other indexed cities in Canada and across North America, and to explore nearby nature and weekend destinations.

Image credit: Image: Pierre Bona / Wikimedia Commons, CC BY-SA 3.0
Canada / North America
Use the Terrebonne profile to compare affordability, livability, and economic indicators against other indexed cities in Canada and across North America, and to explore nearby nature and weekend destinations.

Image credit: Image: Bobanny / Wikimedia Commons, Public domain
Canada / North America
Use the Delta profile to compare affordability, livability, and economic indicators against other indexed cities in Canada and across North America, and to explore nearby nature and weekend destinations.

Image credit: Image: P199 / Wikimedia Commons, CC BY-SA 3.0
Canada / North America
Use the Chatham-Kent profile to compare affordability, livability, and economic indicators against other indexed cities in Canada and across North America, and to explore nearby nature and weekend destinations.

Image credit: Image: Brampton Cyclist / Wikimedia Commons, CC BY 2.0
Canada / North America
Use the Pickering profile to compare affordability, livability, and economic indicators against other indexed cities in Canada and across North America, and to explore nearby nature and weekend destinations.

Image credit: Image: Robert Alfers / Wikimedia Commons, Public domain
Canada / North America
Use the Dartmouth profile to compare affordability, livability, and economic indicators against other indexed cities in Canada and across North America, and to explore nearby nature and weekend destinations.

Image credit: Image: Juraj Tatár / Wikimedia Commons, CC BY-SA 3.0
Canada / North America
Use the Maple Ridge profile to compare affordability, livability, and economic indicators against other indexed cities in Canada and across North America, and to explore nearby nature and weekend destinations.

Image credit: Image: P199 / Wikimedia Commons, CC BY-SA 3.0
Canada / North America
Use the Kawartha Lakes profile to compare affordability, livability, and economic indicators against other indexed cities in Canada and across North America, and to explore nearby nature and weekend destinations.

Image credit: Image: Qyd (talk · contribs) / Wikimedia Commons, CC BY-SA 3.0
Canada / North America
Use the Airdrie profile to compare affordability, livability, and economic indicators against other indexed cities in Canada and across North America, and to explore nearby nature and weekend destinations.
Source-attributed country-level indicators for Canada, drawn from the World Bank Development Indicators. Use the cards and table together to compare scale, unit, and data year for each metric.
Country-level, not city-level
Indicators describe national context. Pair them with city profiles, comparisons, and verified utility layers (emergency, healthcare, transport) for local detail.
Source-attributed where available
Values come from the World Bank Development Indicators. Where no verified record exists, the platform shows a transparent fallback rather than a guessed number.
Different indicators, different years
Each record carries its own data year because publishers refresh indicators on their own cadence. The card and table both display the year alongside the value.
Context, not a ranking
Treat indicators as orientation, not as a leaderboard. The platform never claims any country is best, safest, cleanest, richest, healthiest, or most connected.
Read alongside city intelligence
Country indicators are most useful when combined with the city profiles in the country, the public-safety, healthcare, and transport sections, and the methodology and data-sources pages.
For full construction details, read the methodology page and the data sources registry.
National-level economic signals to read alongside city-level cost and services pages.
GDP per capita
VerifiedEconomic context only — not a cost-of-living score or a household-income measure.
Data year 2024 updated 2026-04-08
Unemployment rate
VerifiedModeled ILO labor-market context — not a guarantee of job availability for any specific worker.
Data year 2025 updated 2026-04-08
National scale and urbanisation context; pair with city profiles for local detail.
Population
VerifiedNational scale only — not a city population value or a measure of urban density.
Data year 2024 updated 2026-04-08
Urban population share
VerifiedShare of population living in urban areas — not a quality-of-life or urban-form measure.
Data year 2024 updated 2026-04-08
Connectivity context drawn from World Bank usage and subscription indicators.
Internet usage
VerifiedShare of population that uses the internet — not a measure of connection speed or quality.
Data year 2024 updated 2026-04-08
Fixed broadband subscriptions
VerifiedFixed broadband subscriptions per 100 people — not a measure of overall internet quality or speed.
Data year 2024 updated 2026-04-08
National health-system context; not a substitute for verified city-level healthcare layers.
Life expectancy
VerifiedNational health-context indicator — not individual health guidance.
Data year 2024 updated 2026-04-08
Health expenditure per capita
VerifiedPer-capita spending context — not a measure of healthcare quality or access for any individual.
Data year 2024 updated 2026-04-08
National emissions context; read separately from city-level air-quality data.
CO₂ emissions per capita
VerifiedNational emissions context — not a city-level air-quality measurement.
Data year 2024 updated 2026-04-08
| Indicator | Value | Unit | Data year | Status |
|---|---|---|---|---|
| Population | 41,288,599 | people | 2024 | Verified |
| Internet usage | 94.35 | percent | 2024 | Verified |
| Urban population share | 82.7 | percent | 2024 | Verified |
| GDP per capita | 54,340.35 | current US$ | 2024 | Verified |
| Life expectancy | 82.11 | years | 2024 | Verified |
| Health expenditure per capita | 6,377.97 | current US$ | 2024 | Verified |
| Unemployment rate | 6.91 | percent | 2025 | Verified |
| CO₂ emissions per capita | 14.0 | metric tons per capita | 2024 | Verified |
| Fixed broadband subscriptions | 42.52 | per 100 people | 2024 | Verified |
Global City Intelligence — country indicators dataset
VerifiedCountry indicator values appear in this section only after they are sourced from accepted publishers and validated at build time. Malformed records cannot ship to production.
Verified emergency contacts for Canada, drawn from official emergency services and government publishers. Use these as a starting point and confirm current details with local authorities before traveling or relocating.
| Service | Number | Notes |
|---|---|---|
| Universal emergency | 91124/7 | 911 reaches police, fire, and emergency medical dispatch in most regions of Canada. |
Each emergency contact above is attributed to an official emergency service or government publisher. Confirm current numbers directly with these sources.
Used as the primary attribution for Canada's 911 universal emergency number.
Last verified: 2026-05-16
Methodology and the wider source registry are documented on the scoring methodology and data sources pages.
Verified national healthcare information for Canada, drawn from official government and public health publishers. This is informational only and does not provide medical advice.
Healthcare system
Publicly funded Medicare delivered by provincial and territorial health insurance plans.
Official health portal
Public health authority
Emergency medical information
Call 911 for medical emergencies in most regions. Hospital emergency departments provide acute care; provincial health insurance covers medically necessary services for residents.
Insurance and access
Coverage and access vary by province or territory. Each province publishes its own health insurance information.
Official hospital registry
Canadian Institute for Health Information
National source of comparable Canadian health-system data and analysis recognised by federal and provincial governments.
Last verified: 2026-05-16
Each entry above is attributed to an official government, public health, or recognised health-system publisher. Confirm current information directly with these sources.
Used as the primary federal attribution for Canadian public-health context.
Used as the primary reference for Canadian health-system statistics and hospital-system framing.
Last verified: 2026-05-16
Related sections: emergency and public safety, scoring methodology, and data sources.
Verified national transport context for Canada, attributed to official transport ministries, national operators, and aviation authorities. This is informational only; routes, fares, and schedules change frequently — check the linked authorities for current details.
Public transport overview
Transport Canada sets federal transport policy and safety standards. Intercity passenger rail is operated by VIA Rail; urban transit is delivered by provincial and municipal authorities.
National transport authority
Rail authority or operator
Each entry above is attributed to an official transport authority, national operator, airport publisher, or government source. Confirm current information directly with these publishers.
Used as the primary federal attribution for Canadian national transport context.
Used as the primary attribution for Canadian national rail operator information.
Last verified: 2026-05-16
Related sections: emergency and public safety, healthcare and hospitals, cities directory, countries directory, scoring methodology, data sources.
Curated city-vs-city comparisons that include at least one city from Canada. Each link opens a comparison page with structured indicators across cost, safety, healthcare, transport, and country context.
North America · Relocation
New York vs Toronto: Cost, Safety, Healthcare & Transport
Compare New York and Toronto across cost of living, air quality, safety, healthcare, transport, and country context for North American relocation and remote-work planning.
North America · Regional alternative
Vancouver vs Toronto: Cost, Safety, Healthcare & Transport
Compare Vancouver and Toronto across cost of living, air quality, safety, healthcare, transport, and country context for Canadian intra-country relocation.
North America · Relocation
Montreal vs Toronto: Cost, Safety, Healthcare & Transport
Compare Montreal and Toronto across cost framing, transport access, country-level healthcare and emergency context, and cultural depth.
North America · Regional alternative
Calgary vs Vancouver: Cost, Safety, Healthcare & Transport
Pair Calgary and Vancouver for a Western-Canada comparison across cost framing, country-level public-service context, and natural-environment considerations.
North America · Regional alternative
Montreal vs Calgary: Cost, Safety, Healthcare & Transport
Compare Montreal and Calgary across cost framing, country-level public-service context, and cultural/linguistic profile for cross-Canada relocation review.
Curated city collections that include at least one Canada city. Each collection is a comparison-oriented shortlist, not an official ranking.
Remote work
A curated city intelligence shortlist for remote workers, comparing cities across cost context, safety, healthcare, transport, connectivity, and relocation utility — not an official ranking.
1 city from Canada in this collection
Family life
A comparison-oriented collection of cities seen through family-relevant context: safety, healthcare, public services, transport, air quality, and livability indicators. Designed for comparison, not as an official family ranking.
2 cities from Canada in this collection
Startups
Compare cities with startup and business relevance through connectivity, infrastructure, transport, and international hub positioning. A curated shortlist, not an official ranking.
1 city from Canada in this collection
Public transport
A mobility-focused city collection comparing cities with useful public-transport context and verified transport or mobility profiles where available.
1 city from Canada in this collection
Explore rankings where supported Canada city profiles appear. Use rankings as directional city intelligence, not an official government ranking.
Ranking
A balanced ranking of cities across affordability, air quality, clean-energy readiness, and resilience.
74 cities from Canada appears in this ranking
Ranking
Cities that combine strong services, mobility, safety, clean air, and resilience into a healthy day-to-day profile.
74 cities from Canada appears in this ranking
Ranking
Cities that combine fast connectivity, safety, healthy day-to-day life, and a manageable cost-of-living balance for remote and hybrid workers.
74 cities from Canada appears in this ranking
Ranking
A health-oriented comparison of city air-quality scores using WHO-centered pollutant interpretation.
74 cities from Canada appears in this ranking
Ranking
Cities ranked by cost-of-living score, weighing housing pressure, essential spending, and household offsets across global metros.
74 cities from Canada appears in this ranking
Ranking
Cities ranked by internet speed, mobile coverage, and digital-readiness depth for residents, businesses, and remote workers.
74 cities from Canada appears in this ranking
Ranking
A ranking of city energy-transition readiness, grid resilience, clean-resource potential, and adaptation capacity.
74 cities from Canada appears in this ranking
Ranking
A practical affordability ranking that weighs housing pressure against transport access, services, and opportunity density.
74 cities from Canada appears in this ranking
See the full rankings directory for every available structured ranking.
Across 74 indexed cities, Vancouver leads at 84/100 and Greater Sudbury sits at 50/100. Use the country page as a parent context layer; module-level detail lives on each city profile. Data year 2025; last updated 2026-05-16. Drawn from 4 institutional references.
Structured indicators on this hub are directional and intended for orientation. Verified utility layers — emergency, healthcare, transport — are attributed to official publishers where available and use transparent fallback states where verified country-level data is not yet integrated.
Structured indicators on this page are directional and intended for orientation. Verified datasets are being integrated; official sources should be used for critical decisions.
4 institutional references inform this view, listed below with reliability notes. Structured indicators on this page are directional and intended for orientation; verified datasets are being integrated and official sources should be used for critical decisions.
Used as a policy and methodology reference for urban exposure and resilience signals.
Used as an energy-resource and weather-normalization reference.
Used to explain urban climate vulnerability and adaptation scoring logic.
Used to ground energy-readiness scoring in international transition guidance.