Supported cities
42
City profiles indexed for Australia.
Oceania
Australia's profile combines high quality of life and outdoor amenity with elevated housing pressure and meaningful climate exposure from heat and bushfire. Australia is indexed at the country level in Oceania, with 42 city profiles linked below.

Image credit: Image: Reto Stöckl / NASA Goddard Space Flight Center / Wikimedia Commons, Public domain
Additional verified imagery for Australia. Each photo is sourced from Wikimedia Commons with full attribution and a permissive license.
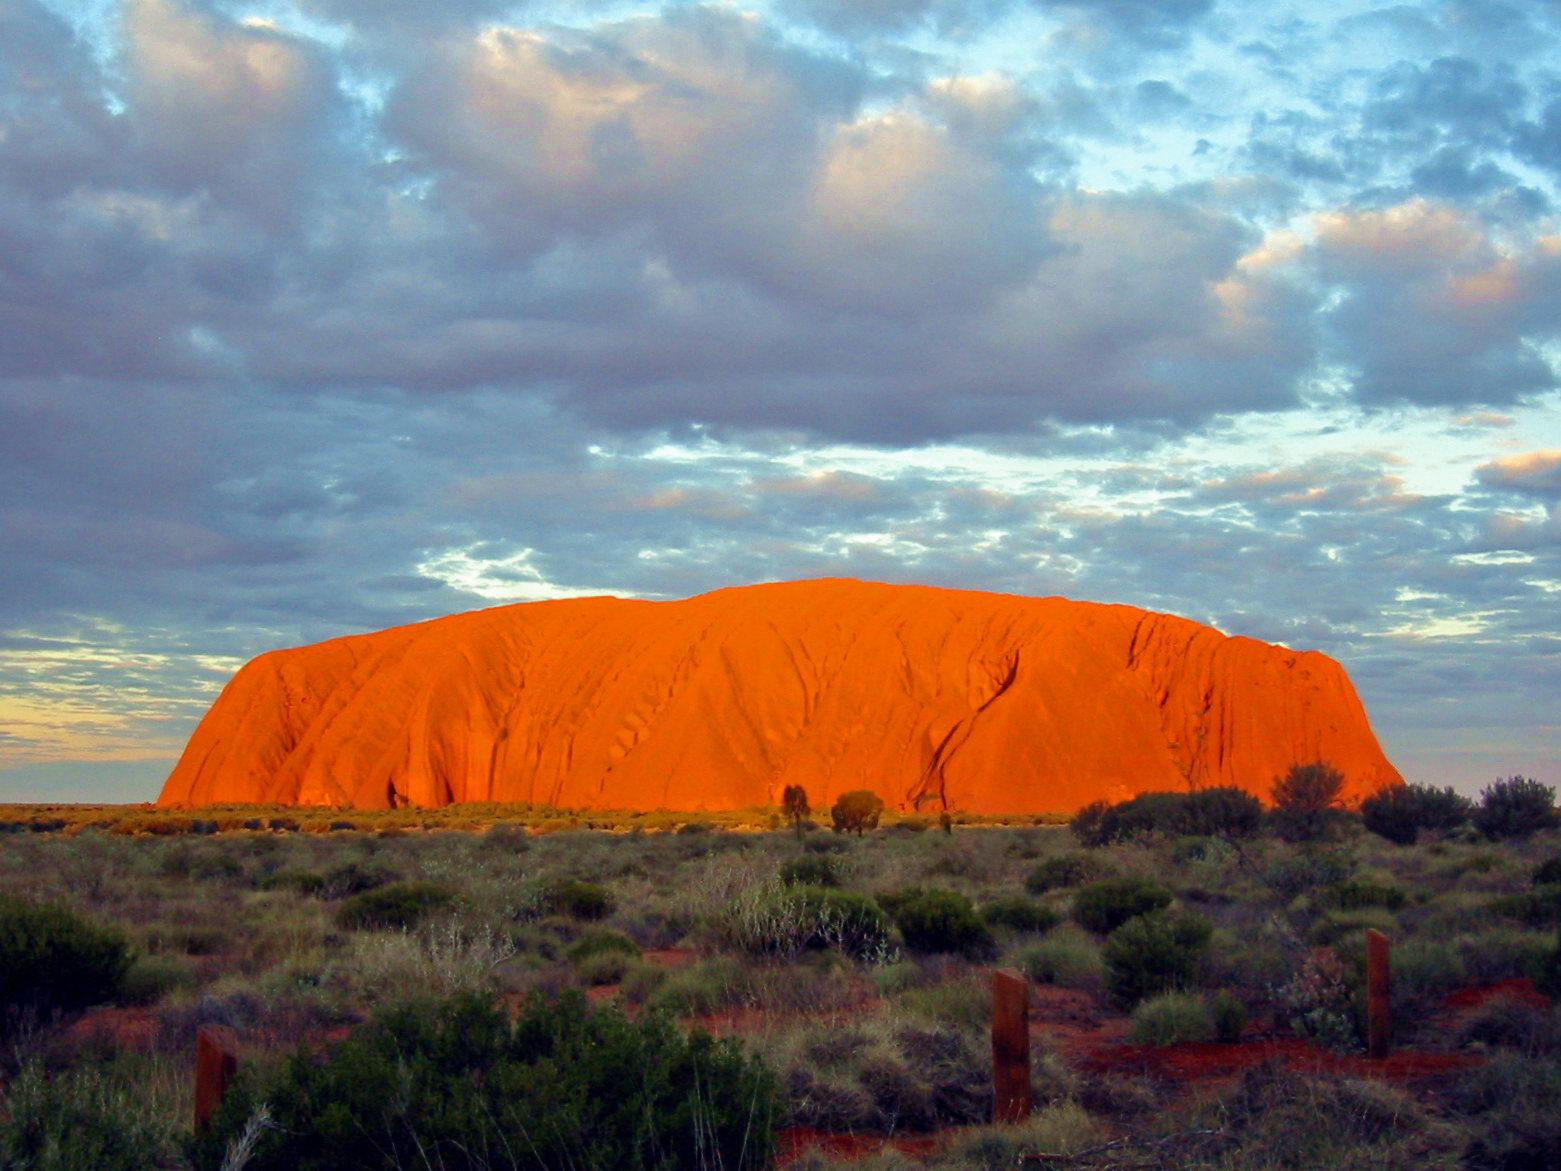
Uluru
Image credit: Image: Thomas Schoch / Wikimedia Commons, CC BY-SA 3.0
Snapshot of structured Australia city intelligence and which verified utility layers are available on this hub.
Supported cities
42
City profiles indexed for Australia.
Emergency profile
Verified
Country emergency contacts attributed to official publishers.
Healthcare profile
Verified
Healthcare layer attributed to official health authorities.
Transport profile
Verified
Transport authority and operator references attributed to official sources.
Related comparisons
5
Curated city-vs-city comparison pages that reference this country.
Related collections
2
Best Cities collections that include at least one city from this country.
Data year
2025
Reference year for the country intelligence dataset.
Last updated
2026-05-16
Most recent platform-side review of the country hub.
Very high
Coastal and outdoor amenity supports a high quality of daily life.
Heat and bushfire
Heat and bushfire pressure are central adaptation priorities.
High
Housing pressure is the main resident well-being constraint in major cities.
Country pages group cities into crawlable clusters and give national context without replacing city-level comparisons.
| Metric | Value | Context |
|---|---|---|
| Region | Oceania | Used for geographic clustering and regional comparisons. |
| Indexed cities | 42 | Alice Springs, Mount Gambier, Orange, Central Coast, Gladstone, Bundaberg, Kalgoorlie, Tamworth, Dubbo, Sydney, Melbourne, Brisbane, Perth, Adelaide, Canberra, Hobart, Gold Coast, Newcastle, Darwin, Cairns, Wollongong, Geelong, Sunshine Coast, Townsville, Toowoomba, Ballarat, Bendigo, Launceston, Mackay, Bunbury, Albury, Port Macquarie, Mildura, Wagga Wagga, Coffs Harbour, Geraldton, Rockhampton, Devonport, Ipswich, Hervey Bay, Frankston, Bathurst |
| Outdoor amenity | Very high | Coastal and outdoor amenity supports a high quality of daily life. |
| Climate exposure | Heat and bushfire | Heat and bushfire pressure are central adaptation priorities. |
| Affordability pressure | High | Housing pressure is the main resident well-being constraint in major cities. |
Each linked city page includes its own metadata, data table, source block, module links, and any verified utility layers.
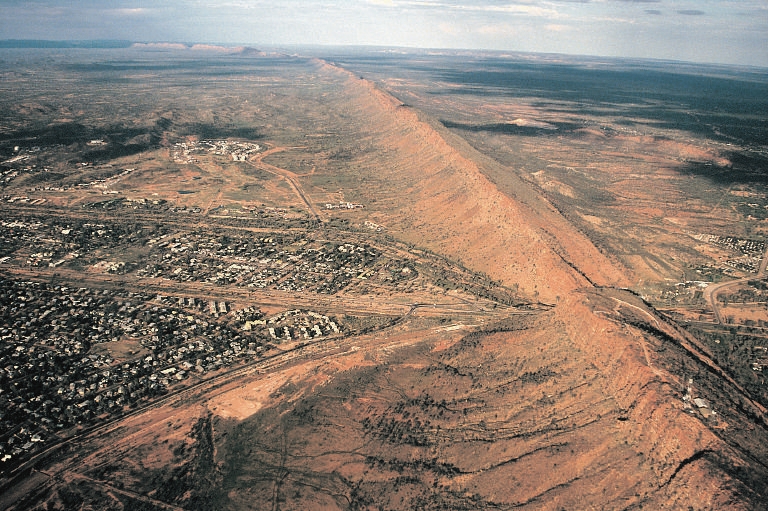
Image credit: Image: Stephen Codrington / Wikimedia Commons, CC BY 2.5
Australia / Oceania
Use the Alice Springs profile to compare airport access, tourism demand, and climate dimensions alongside Darwin, Adelaide, and Cairns.

Image credit: Image: No machine-readable author provided. Roo72 assumed (based on copyright claims). / Wikimedia Commons, CC BY-SA 3.0
Australia / Oceania
Use the Mount Gambier profile to compare affordability, regional-services access, and nature-proximity dimensions alongside Adelaide, Melbourne, and Geelong.

Image credit: Image: Athaydesbr / Wikimedia Commons, CC BY-SA 3.0
Australia / Oceania
Use the Orange profile to compare affordability, regional-services access, and nature-proximity dimensions alongside Sydney, Canberra, and Newcastle.

Image credit: Image: Greenguytroy / Wikimedia Commons, CC BY-SA 4.0
Australia / Oceania
Use the Central Coast profile to compare transport access, housing affordability, and coastal climate-adaptation context alongside regional peers such as Newcastle, Wollongong, and Sydney.

Image credit: Image: JoePerchard / Wikimedia Commons, CC BY-SA 4.0
Australia / Oceania
Use the Gladstone profile to compare industrial air-quality framing, energy-transition context, and affordability alongside regional peers such as Rockhampton, Mackay, and Townsville.

Image credit: Image: Nicolaroch / Wikimedia Commons, CC BY-SA 3.0
Australia / Oceania
Use the Bundaberg profile to compare cost framing, healthcare access, and climate-resilience dimensions alongside regional peers such as the Sunshine Coast, Brisbane, and Cairns.

Image credit: Image: aussiejeff / Wikimedia Commons, CC BY 3.0
Australia / Oceania
Use the Kalgoorlie profile to compare energy and resource-economy context, affordability, and climate-resilience dimensions alongside regional peers such as Perth, Geraldton, and Bunbury.

Image credit: Image: Felix Andrews (Floybix) / Wikimedia Commons, CC BY-SA 3.0
Australia / Oceania
Use the Tamworth profile to compare cost framing, healthcare access, and climate-resilience dimensions alongside regional peers such as Newcastle, Wollongong, and Sydney.

Image credit: Image: Tim Keegan / Wikimedia Commons, CC BY-SA 2.0
Australia / Oceania
Use the Dubbo profile to compare healthcare access, cost framing, and climate-resilience dimensions alongside regional peers such as Canberra, Sydney, and Wollongong.

Image credit: Image: W. Bulach / Wikimedia Commons, CC BY-SA 4.0
Australia / Oceania
Sydney is most useful for users comparing service quality and outdoor amenity against housing pressure and climate hazard.

Image credit: Image: Shkuru Afshar / Wikimedia Commons, CC BY-SA 4.0
Australia / Oceania
Melbourne is most useful for users comparing cultural depth, services, and connectivity against high housing pressure and rising heat exposure.

Image credit: Image: Chris Olszewski / Wikimedia Commons, CC BY-SA 4.0
Australia / Oceania
Brisbane is most useful for users comparing outdoor amenity, growing services activity, and connectivity against heat and storm-exposure considerations.
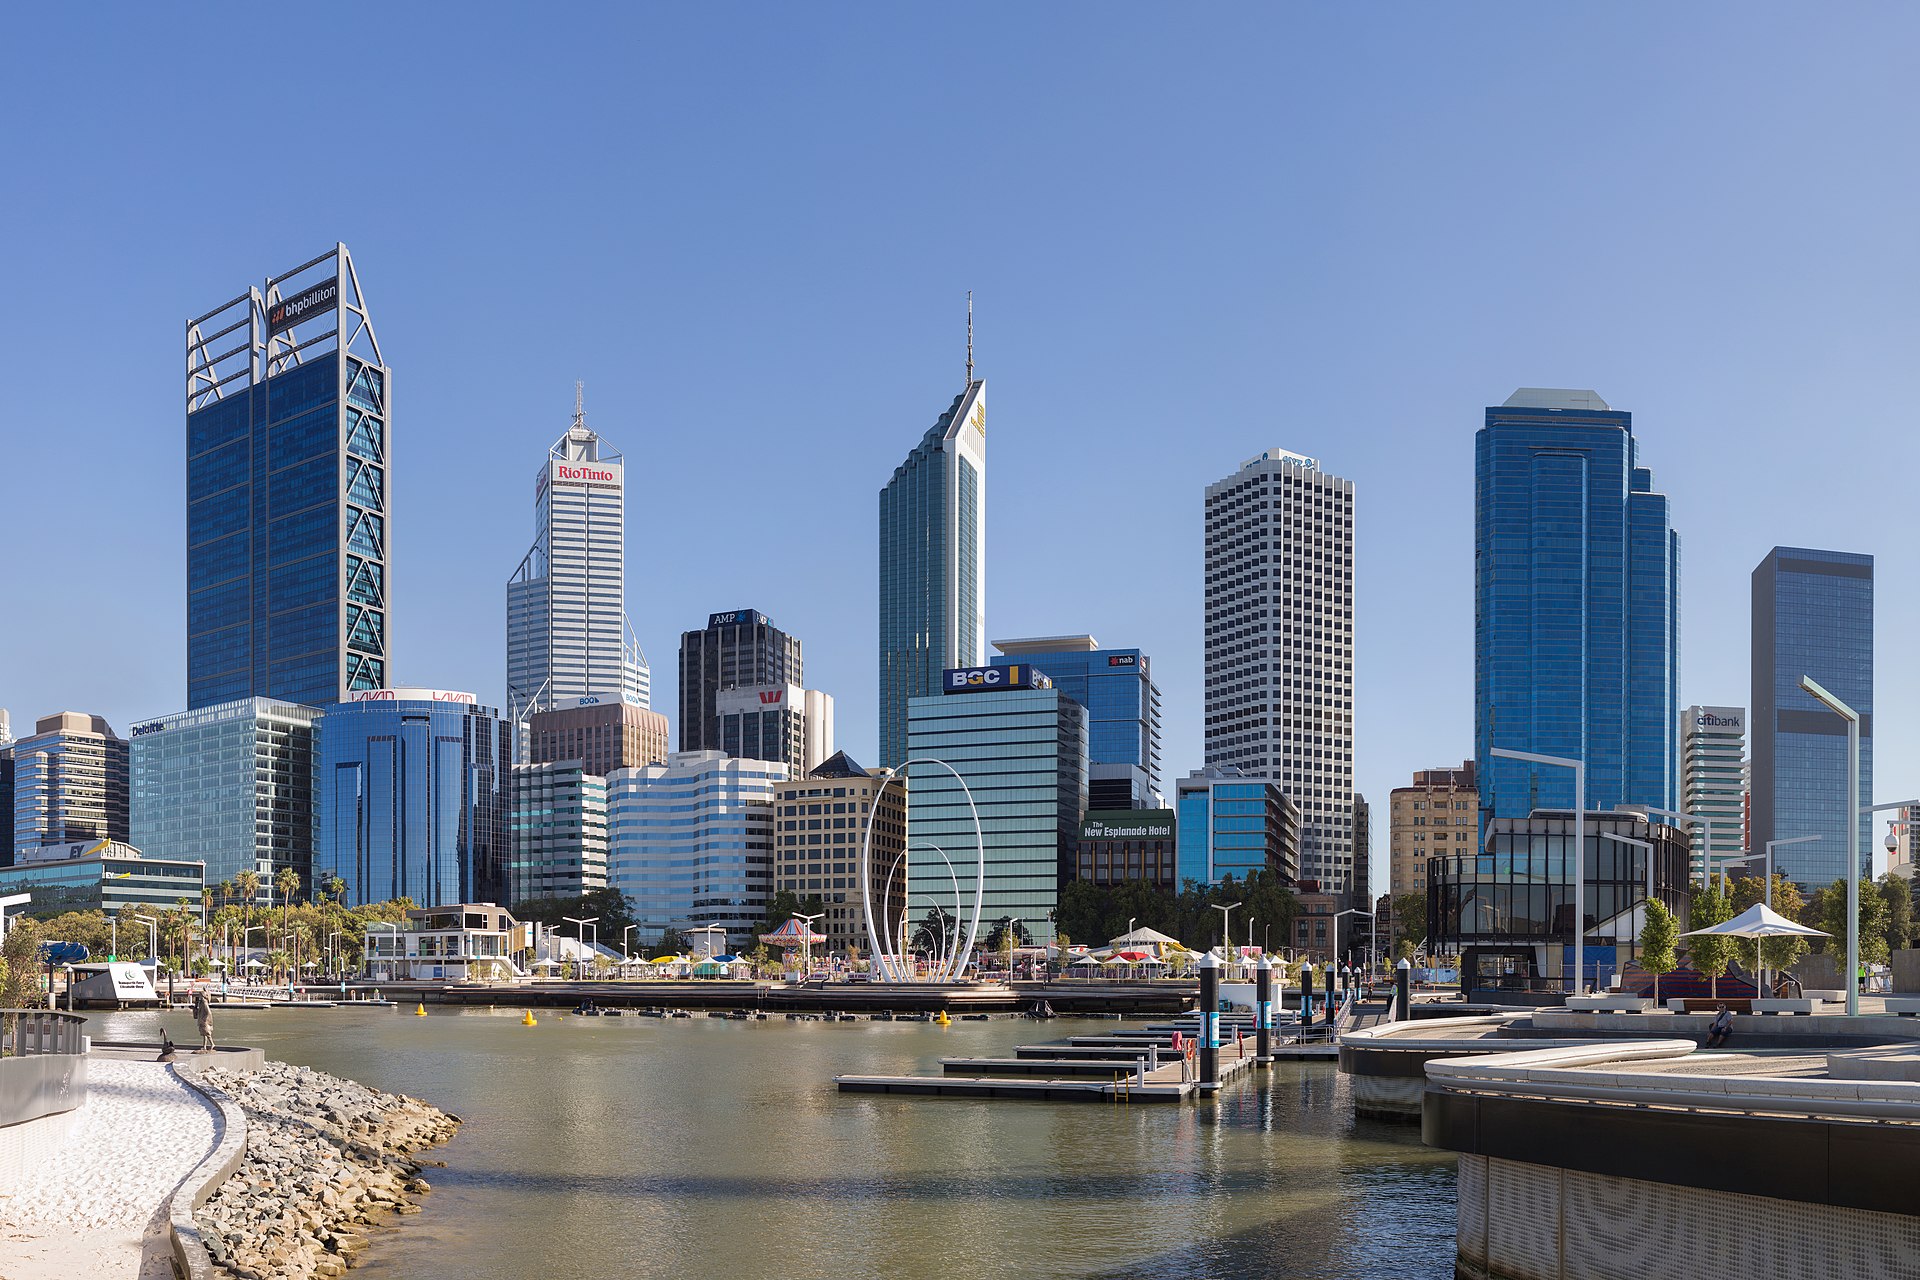
Image credit: Image: Samuel Wiki / Wikimedia Commons, CC BY 4.0
Australia / Oceania
Read Perth as an isolated but high-amenity coastal capital where service quality and outdoor amenity balance housing pressure and drought-resilience priorities.

Image credit: Image: Photograph by Doug Barber / Wikimedia Commons, CC BY-SA 3.0
Australia / Oceania
Use the Adelaide profile to compare cost framing, country-level transport and healthcare context, and quality-of-life signals.

Image credit: Image: Tim J Keegan from Lake Macquarie, Australia / Wikimedia Commons, CC BY-SA 2.0
Australia / Oceania
Use the Canberra profile to compare cost framing, country-level context, and quality-of-life signals alongside other Australian metros.

Image credit: Image: Michael fromholtz / Wikimedia Commons, CC BY-SA 4.0
Australia / Oceania
Use the Hobart profile to compare cost framing, mobility, and quality-of-life signals alongside Melbourne, Adelaide, and other Australian metros.

Image credit: Image: E-CBD / Wikimedia Commons, CC BY-SA 3.0
Australia / Oceania
Use the Gold Coast profile to compare cost framing, mobility, and coastal-resilience signals alongside Brisbane and other Australian metros.

Image credit: Image: Doug Beckers from Avoca Beach, Australia / Wikimedia Commons, CC BY-SA 2.0
Australia / Oceania
Use the Newcastle profile to compare cost framing, transport access, and coastal-resilience signals alongside Sydney, Wollongong, and other Australian metros.

Image credit: Image: W. Bulach / Wikimedia Commons, CC BY-SA 4.0
Australia / Oceania
Use the Darwin profile to compare cost framing, transport access, and tropical-resilience signals alongside other Australian and equatorial-region metros.

Image credit: Image: Frances76 at English Wikipedia / Wikimedia Commons, CC BY-SA 3.0
Australia / Oceania
Use the Cairns profile to compare cost framing, transport access, and tropical-resilience signals alongside Darwin, Brisbane, and other Australian metros.

Image credit: Image: m / Wikimedia Commons, CC BY-SA 4.0
Australia / Oceania
Use the Wollongong profile to compare cost framing, transport access, and country-level context alongside Sydney and Newcastle.
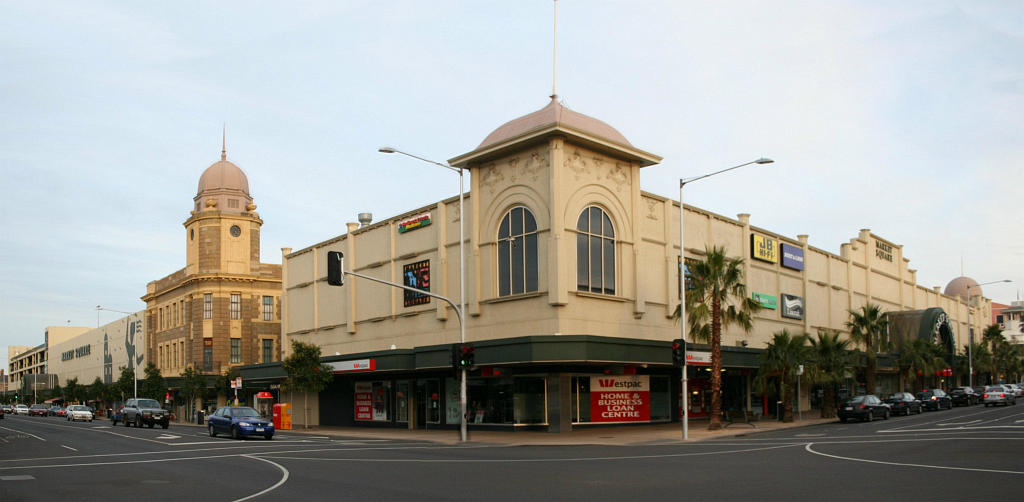
Image credit: Image: Marcus Wong Wongm / Wikimedia Commons, CC BY-SA 3.0
Australia / Oceania
Use the Geelong profile to compare cost framing, transport access, and country-level context alongside Melbourne and Ballarat-region peers.

Image credit: Image: S. Newrick / Wikimedia Commons, CC BY-SA 4.0
Australia / Oceania
Use the Sunshine Coast profile to compare cost framing, transport access, and country-level Queensland context alongside Brisbane and Gold Coast.

Image credit: Image: Hanek45 at English Wikipedia / Wikimedia Commons, Public domain
Australia / Queensland
Use this record as a regional planning anchor while deeper source integration is pending. Verify access, transport, and seasonal context with official sources before relying on the page for travel decisions.
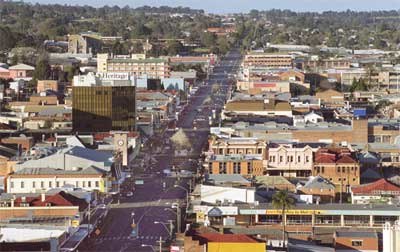
Image credit: Image: Danubis / Wikimedia Commons, CC BY-SA 3.0
Australia / Queensland
Use this record as a regional planning anchor while deeper source integration is pending. Verify access, transport, and seasonal context with official sources before relying on the page for travel decisions.

Image credit: Image: Gervo1865 at English Wikipedia / Wikimedia Commons, CC BY 2.5
Australia / Victoria
Use this record as a regional planning anchor while deeper source integration is pending. Verify access, transport, and seasonal context with official sources before relying on the page for travel decisions.

Image credit: Image: Christophe95 / Wikimedia Commons, CC BY-SA 4.0
Australia / Victoria
Use this record as a regional planning anchor while deeper source integration is pending. Verify access, transport, and seasonal context with official sources before relying on the page for travel decisions.

Image credit: Image: Wikivoyage user Plug (WT-shared) / Wikimedia Commons, Public domain
Australia / Tasmania
Use this record as a regional planning anchor while deeper source integration is pending. Verify access, transport, and seasonal context with official sources before relying on the page for travel decisions.

Image credit: Image: C.mcintyre01 / Wikimedia Commons, CC BY-SA 3.0
Australia / Queensland
Use this record as a planning anchor for local-first research and nearby weekend-rest discovery, verifying access, transport, and seasonal context with official sources.

Image credit: Image: Bram Souffreau / Wikimedia Commons, CC BY-SA 2.0
Australia / Western Australia
Use this record as a planning anchor for local-first research and nearby weekend-rest discovery, verifying access, transport, and seasonal context with official sources.
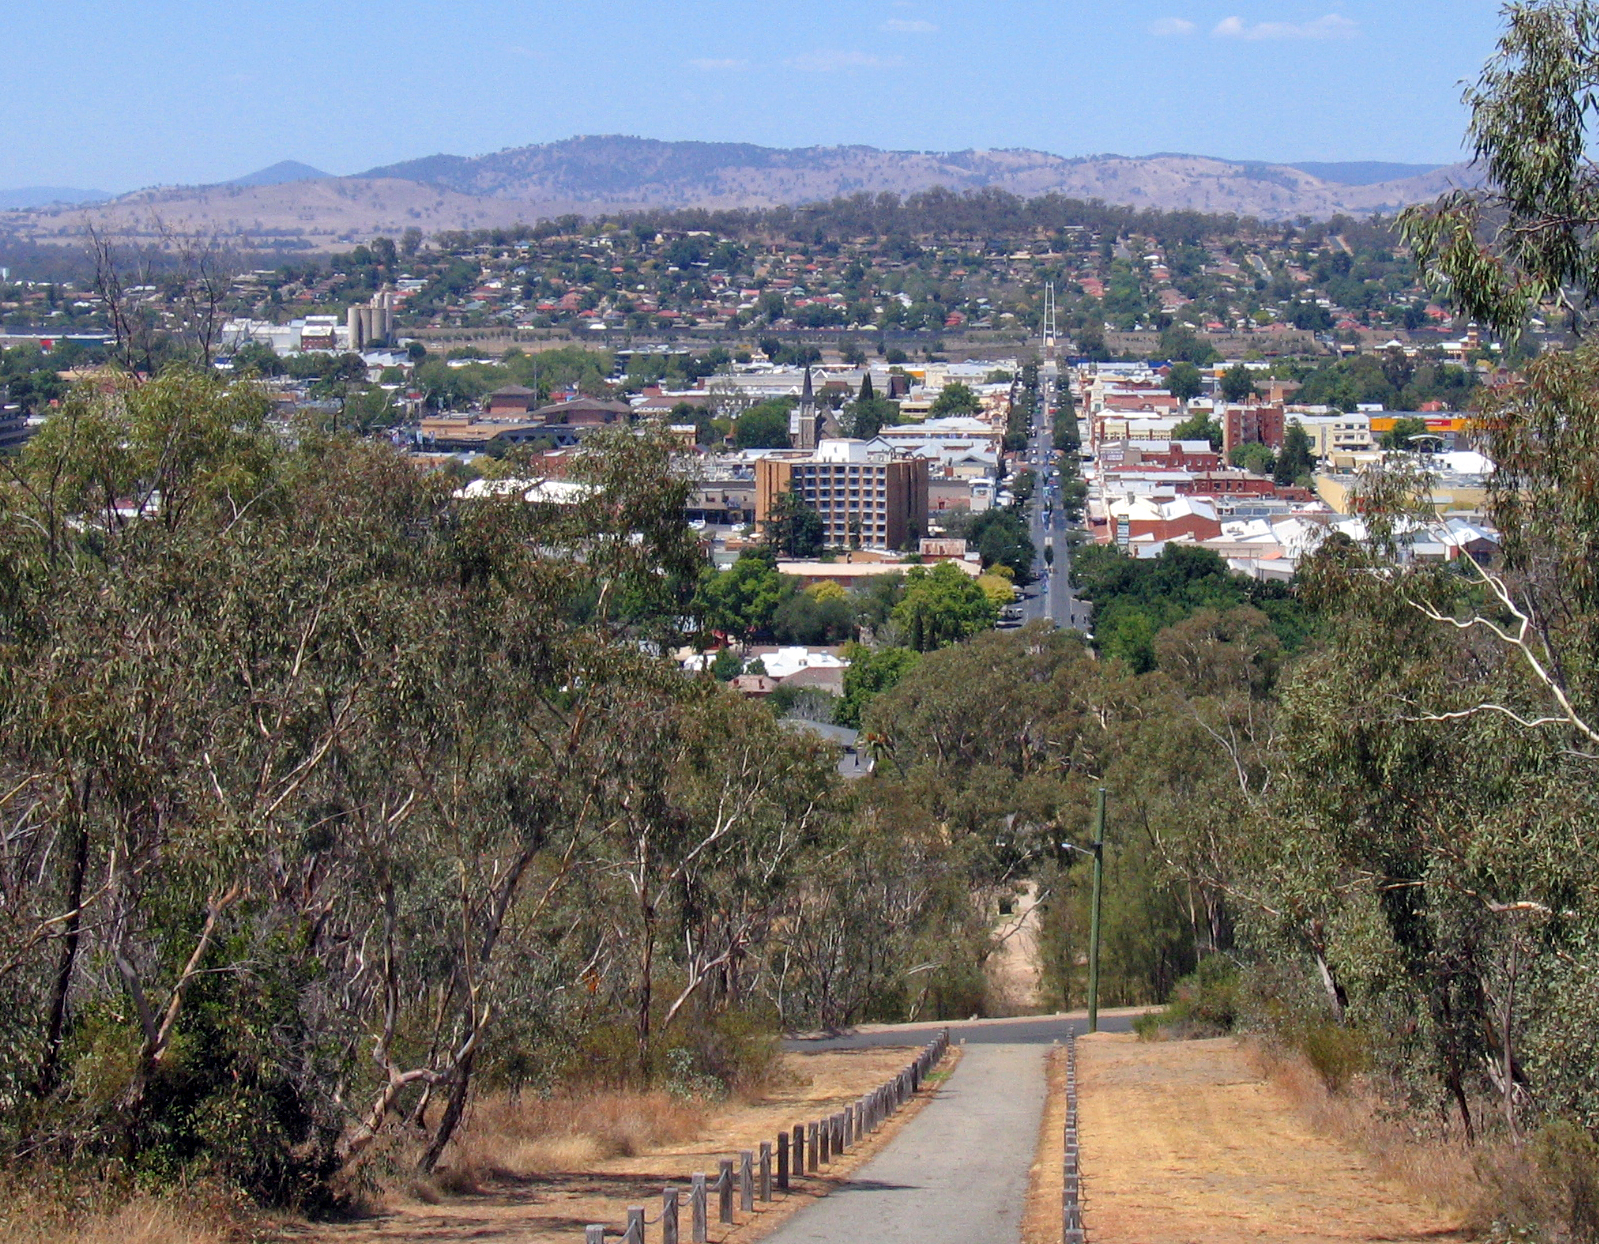
Image credit: Image: Tim / Wikimedia Commons, CC BY-SA 2.0
Australia / New South Wales
Use this record as a planning anchor for local-first research and nearby weekend-rest discovery, verifying access, transport, and seasonal context with official sources.

Image credit: Image: Kert58 at English Wikipedia / Wikimedia Commons, Public domain
Australia / New South Wales
Use this record as a planning anchor for local-first research and nearby weekend-rest discovery, verifying access, transport, and seasonal context with official sources.

Image credit: Image: The original uploader was Longhair at English Wikipedia. / Wikimedia Commons, CC BY 2.5
Australia / Victoria
Use this record as a planning anchor for local-first research and nearby weekend-rest discovery, verifying access, transport, and seasonal context with official sources.

Image credit: Image: Bidgee / Wikimedia Commons, CC BY 3.0
Australia / New South Wales
Treat this record as a planning anchor for local-first research and nearby weekend-rest discovery, verifying access, transport, and seasonal details with official sources.

Image credit: Image: Paul Lakin / Wikimedia Commons, CC BY 3.0
Australia / New South Wales
Treat this record as a planning anchor for local-first research and nearby weekend-rest discovery, verifying access, transport, and seasonal details with official sources.

Image credit: Image: W. Bulach / Wikimedia Commons, CC BY-SA 4.0
Australia / Western Australia
Treat this record as a planning anchor for local-first research and nearby weekend-rest discovery, verifying access, transport, and seasonal details with official sources.

Image credit: Image: ZayZayEM at English Wikipedia / Wikimedia Commons, CC BY-SA 3.0
Australia / Queensland
Treat this record as a planning anchor for local-first research and nearby weekend-rest discovery, verifying access, transport, and seasonal details with official sources.

Image credit: Image: YSSYguy at English Wikipedia / Wikimedia Commons, CC BY-SA 3.0
Australia / Tasmania
This record works as a planning anchor for local-first research and nearby weekend-rest discovery, with travellers advised to verify ferry schedules, transport links, and seasonal access through official sources.

Image credit: Image: Chris Olszewski / Wikimedia Commons, CC BY-SA 4.0
Australia / Oceania
Use the Ipswich profile to compare affordability, livability, and economic indicators against other indexed cities in Australia and across Oceania, and to explore nearby nature and weekend destinations.

Image credit: Image: L.Wadsworth at English Wikipedia / Wikimedia Commons, CC BY-SA 3.0
Australia / Oceania
Use the Hervey Bay profile to compare affordability, livability, and economic indicators against other indexed cities in Australia and across Oceania, and to explore nearby nature and weekend destinations.

Image credit: Image: NouvelleAuteur / Wikimedia Commons, CC BY-SA 4.0
Australia / Oceania
Use the Frankston profile to compare affordability, livability, and economic indicators against other indexed cities in Australia and across Oceania, and to explore nearby nature and weekend destinations.

Image credit: Image: Mountain Ash / Wikimedia Commons, CC BY 2.0
Australia / Oceania
Use the Bathurst profile to compare affordability, livability, and economic indicators against other indexed cities in Australia and across Oceania, and to explore nearby nature and weekend destinations.
Source-attributed country-level indicators for Australia, drawn from the World Bank Development Indicators. Use the cards and table together to compare scale, unit, and data year for each metric.
Country-level, not city-level
Indicators describe national context. Pair them with city profiles, comparisons, and verified utility layers (emergency, healthcare, transport) for local detail.
Source-attributed where available
Values come from the World Bank Development Indicators. Where no verified record exists, the platform shows a transparent fallback rather than a guessed number.
Different indicators, different years
Each record carries its own data year because publishers refresh indicators on their own cadence. The card and table both display the year alongside the value.
Context, not a ranking
Treat indicators as orientation, not as a leaderboard. The platform never claims any country is best, safest, cleanest, richest, healthiest, or most connected.
Read alongside city intelligence
Country indicators are most useful when combined with the city profiles in the country, the public-safety, healthcare, and transport sections, and the methodology and data-sources pages.
For full construction details, read the methodology page and the data sources registry.
National-level economic signals to read alongside city-level cost and services pages.
GDP per capita
VerifiedEconomic context only — not a cost-of-living score or a household-income measure.
Data year 2024 updated 2026-04-08
Unemployment rate
VerifiedModeled ILO labor-market context — not a guarantee of job availability for any specific worker.
Data year 2025 updated 2026-04-08
National scale and urbanisation context; pair with city profiles for local detail.
Population
VerifiedNational scale only — not a city population value or a measure of urban density.
Data year 2024 updated 2026-04-08
Urban population share
VerifiedShare of population living in urban areas — not a quality-of-life or urban-form measure.
Data year 2024 updated 2026-04-08
Connectivity context drawn from World Bank usage and subscription indicators.
Internet usage
VerifiedShare of population that uses the internet — not a measure of connection speed or quality.
Data year 2024 updated 2026-04-08
Fixed broadband subscriptions
VerifiedFixed broadband subscriptions per 100 people — not a measure of overall internet quality or speed.
Data year 2024 updated 2026-04-08
National health-system context; not a substitute for verified city-level healthcare layers.
Life expectancy
VerifiedNational health-context indicator — not individual health guidance.
Data year 2024 updated 2026-04-08
Health expenditure per capita
VerifiedPer-capita spending context — not a measure of healthcare quality or access for any individual.
Data year 2023 updated 2026-04-08
National emissions context; read separately from city-level air-quality data.
CO₂ emissions per capita
VerifiedNational emissions context — not a city-level air-quality measurement.
Data year 2024 updated 2026-04-08
| Indicator | Value | Unit | Data year | Status |
|---|---|---|---|---|
| Population | 27,196,812 | people | 2024 | Verified |
| Internet usage | 96.13 | percent | 2024 | Verified |
| Urban population share | 87.6 | percent | 2024 | Verified |
| GDP per capita | 64,603.99 | current US$ | 2024 | Verified |
| Life expectancy | 83.05 | years | 2024 | Verified |
| Health expenditure per capita | 6,980.39 | current US$ | 2023 | Verified |
| Unemployment rate | 4.09 | percent | 2025 | Verified |
| CO₂ emissions per capita | 14.1 | metric tons per capita | 2024 | Verified |
| Fixed broadband subscriptions | 36.48 | per 100 people | 2024 | Verified |
Global City Intelligence — country indicators dataset
VerifiedCountry indicator values appear in this section only after they are sourced from accepted publishers and validated at build time. Malformed records cannot ship to production.
Verified emergency contacts for Australia, drawn from official emergency services and government publishers. Use these as a starting point and confirm current details with local authorities before traveling or relocating.
| Service | Number | Notes |
|---|---|---|
| Universal emergency (Triple Zero) | 00024/7 | 000 reaches police, fire, and ambulance dispatch nationally; 112 also works from mobile phones. |
Each emergency contact above is attributed to an official emergency service or government publisher. Confirm current numbers directly with these sources.
Used as the primary attribution for Australia's 000 universal emergency number.
Last verified: 2026-05-16
Methodology and the wider source registry are documented on the scoring methodology and data sources pages.
Verified national healthcare information for Australia, drawn from official government and public health publishers. This is informational only and does not provide medical advice.
Healthcare system
Publicly funded Medicare alongside private health insurance and a hospital system jointly operated by federal and state governments.
Official health portal
Public health authority
Emergency medical information
Call 000 for medical emergencies. Public hospital emergency departments provide acute care.
Insurance and access
Medicare provides subsidised access to many services for eligible residents; private insurance covers additional services.
Official hospital registry
MyHospitals — Australian Institute of Health and Welfare
Official Australian Government statistical agency portal with hospital information across the country.
Last verified: 2026-05-16
Each entry above is attributed to an official government, public health, or recognised health-system publisher. Confirm current information directly with these sources.
Used as the primary federal attribution for Australian public-health context.
Used as the official Australian hospital registry reference for verified facility lookups.
Last verified: 2026-05-16
Related sections: emergency and public safety, scoring methodology, and data sources.
Verified national transport context for Australia, attributed to official transport ministries, national operators, and aviation authorities. This is informational only; routes, fares, and schedules change frequently — check the linked authorities for current details.
Public transport overview
Federal policy is set by the Department of Infrastructure, Transport, Regional Development; aviation safety is overseen by CASA. Urban and regional public transport is delivered by state government authorities.
National transport authority
Department of Infrastructure, Transport, Regional Development
Aviation authority
Each entry above is attributed to an official transport authority, national operator, airport publisher, or government source. Confirm current information directly with these publishers.
Used as the primary federal attribution for Australian national transport context.
Used as the primary attribution for Australian aviation authority information.
Last verified: 2026-05-16
Related sections: emergency and public safety, healthcare and hospitals, cities directory, countries directory, scoring methodology, data sources.
Curated city-vs-city comparisons that include at least one city from Australia. Each link opens a comparison page with structured indicators across cost, safety, healthcare, transport, and country context.
Oceania · Regional alternative
Sydney vs Melbourne: Cost, Safety, Healthcare & Transport
Compare Sydney and Melbourne across cost of living, air quality, safety, healthcare, transport, and country context for Australian intra-country relocation.
Oceania · Regional alternative
Brisbane vs Perth: Cost, Safety, Healthcare & Transport
Compare Brisbane and Perth across cost of living, air quality, safety, healthcare, transport, and country context for Australian inter-state relocation.
Global · Relocation
Singapore vs Sydney: Cost, Safety, Healthcare & Transport
Compare Singapore and Sydney across cost of living, air quality, safety, healthcare, transport, and country context for Asia-Pacific relocation planning.
Oceania · Regional alternative
Adelaide vs Melbourne: Cost, Safety, Healthcare & Transport
Compare Adelaide and Melbourne across cost framing, transport access, and country-level public-service context for Australian intra-country relocation review.
Oceania · Regional alternative
Canberra vs Sydney: Cost, Safety, Healthcare & Transport
Pair Canberra and Sydney for an Australian capital-versus-largest-metro comparison across cost framing, transport access, and country-level context.
Curated city collections that include at least one Australia city. Each collection is a comparison-oriented shortlist, not an official ranking.
Family life
A comparison-oriented collection of cities seen through family-relevant context: safety, healthcare, public services, transport, air quality, and livability indicators. Designed for comparison, not as an official family ranking.
2 cities from Australia in this collection
Clean air
An air quality-oriented city collection. Designed for comparison through WHO and regional air-quality context — not a ranked claim of which city has the cleanest air.
2 cities from Australia in this collection
Explore rankings where supported Australia city profiles appear. Use rankings as directional city intelligence, not an official government ranking.
Ranking
A balanced ranking of cities across affordability, air quality, clean-energy readiness, and resilience.
42 cities from Australia appears in this ranking
Ranking
Cities that combine strong services, mobility, safety, clean air, and resilience into a healthy day-to-day profile.
42 cities from Australia appears in this ranking
Ranking
Cities that combine fast connectivity, safety, healthy day-to-day life, and a manageable cost-of-living balance for remote and hybrid workers.
42 cities from Australia appears in this ranking
Ranking
A health-oriented comparison of city air-quality scores using WHO-centered pollutant interpretation.
42 cities from Australia appears in this ranking
Ranking
Cities ranked by cost-of-living score, weighing housing pressure, essential spending, and household offsets across global metros.
42 cities from Australia appears in this ranking
Ranking
Cities ranked by internet speed, mobile coverage, and digital-readiness depth for residents, businesses, and remote workers.
42 cities from Australia appears in this ranking
Ranking
A ranking of city energy-transition readiness, grid resilience, clean-resource potential, and adaptation capacity.
42 cities from Australia appears in this ranking
Ranking
A practical affordability ranking that weighs housing pressure against transport access, services, and opportunity density.
42 cities from Australia appears in this ranking
See the full rankings directory for every available structured ranking.
Across 42 indexed cities, Melbourne leads at 86/100 and Devonport sits at 50/100. Use the country page as a parent context layer; module-level detail lives on each city profile. Data year 2025; last updated 2026-05-16. Drawn from 3 institutional references.
Structured indicators on this hub are directional and intended for orientation. Verified utility layers — emergency, healthcare, transport — are attributed to official publishers where available and use transparent fallback states where verified country-level data is not yet integrated.
Structured indicators on this page are directional and intended for orientation. Verified datasets are being integrated; official sources should be used for critical decisions.
3 institutional references inform this view, listed below with reliability notes. Structured indicators on this page are directional and intended for orientation; verified datasets are being integrated and official sources should be used for critical decisions.
Used as a policy and methodology reference for urban exposure and resilience signals.
Used as an energy-resource and weather-normalization reference.
Used to explain urban climate vulnerability and adaptation scoring logic.