Supported cities
106
City profiles indexed for Japan.
East Asia
Japan's country profile is shaped by dense transit-oriented cities, high infrastructure discipline, and serious climate and seismic adaptation needs. Japan is indexed at the country level in East Asia, with 106 city profiles linked below.

Image credit: Image: Jeff Schmaltz, MODIS Rapid Response Team, NASA/GSFC / Wikimedia Commons, Public domain
Additional verified imagery for Japan. Each photo is sourced from Wikimedia Commons with full attribution and a permissive license.

Mount Fuji
Image credit: Image: 名古屋太郎, (edited by Hannes_24) / Wikimedia Commons, CC BY-SA 3.0
Snapshot of structured Japan city intelligence and which verified utility layers are available on this hub.
Supported cities
106
City profiles indexed for Japan.
Emergency profile
Verified
Country emergency contacts attributed to official publishers.
Healthcare profile
Verified
Healthcare layer attributed to official health authorities.
Transport profile
Verified
Transport authority and operator references attributed to official sources.
Related comparisons
4
Curated city-vs-city comparison pages that reference this country.
Related collections
1
Best Cities collections that include at least one city from this country.
Data year
2025
Reference year for the country intelligence dataset.
Last updated
2026-05-16
Most recent platform-side review of the country hub.
Very high
Urban systems are supported by mature rail, emergency planning, and engineering capacity.
High
Heat, flood, storm, and seismic exposure make resilience central.
Strong
Dense service networks reduce daily-life friction in major cities.
Country pages group cities into crawlable clusters and give national context without replacing city-level comparisons.
| Metric | Value | Context |
|---|---|---|
| Region | East Asia | Used for geographic clustering and regional comparisons. |
| Indexed cities | 106 | Tokyo, Osaka, Kyoto, Fukuoka, Nagoya, Sapporo, Yokohama, Hiroshima, Kobe, Nagasaki, Sendai, Saitama, Chiba, Niigata, Nagano, Kumamoto, Nara, Shizuoka, Kagoshima, Kanazawa, Kitakyūshū, Okayama, Kawasaki, Naha, Matsuyama, Aomori, Fukushima, Gifu, Akita, Toyama, Morioka, Ōita-shi, Takamatsu, Utsunomiya, Wakayama, Otsu, Miyazaki, Kōchi-shi, Maebashi, Tokushima, Hakodate, Mito, Yamagata, Hamamatsu, Fukui, Himeji, Saga, Tsu, Tottori, Matsue, Kofu, Yamaguchi, Asahikawa, Toyohashi, Sakai, Okazaki, Sagamihara, Ichikawa, Matsumoto, Kurume, Hachinohe, Odawara, Toyota, Suzuka, Akashi, Nagaoka, Yokosuka, Hirosaki, Amagasaki, Kamakura, Obihiro, Funabashi, Yonago, Fukuyama, Takasaki, Aizuwakamatsu, Shimonoseki, Iwata, Nishinomiya, Kawaguchi, Kurashiki, Kashiwa, Marugame, Fujieda, Kuwana, Kisarazu, Hikone, Kawagoe, Sakura, Kariya, Matsudo, Ichinomiya, Karatsu, Fujisawa, Kōriyama, Higashiōsaka-shi, Iwaki, Kasugai, Suita, Ueda, Mishima, Koshigaya, Yokkaichi, Hirakata, Koga, Muroran |
| Infrastructure reliability | Very high | Urban systems are supported by mature rail, emergency planning, and engineering capacity. |
| Adaptation priority | High | Heat, flood, storm, and seismic exposure make resilience central. |
| Urban access | Strong | Dense service networks reduce daily-life friction in major cities. |
Each linked city page includes its own metadata, data table, source block, module links, and any verified utility layers.

Image credit: Image: Morio / Wikimedia Commons, CC BY-SA 3.0
Japan / East Asia
Tokyo is strongest where density, reliability, and day-to-day service access matter more than low costs or large private space.

Image credit: Image: 663highland / Wikimedia Commons, CC BY 2.5
Japan / East Asia
Read Osaka as a mature, transit-rich metropolitan economy where service density and infrastructure depth balance climate exposure.

Image credit: Image: Basile Morin / Wikimedia Commons, CC BY-SA 4.0
Japan / East Asia
Read Kyoto as a heritage-rich, walkable mid-sized city where cultural depth and service quality balance seasonal tourism pressure.

Image credit: Image: そらみみ / Wikimedia Commons, CC BY-SA 4.0
Japan / East Asia
Use the Fukuoka profile to compare cost framing, transport access, and country-level context alongside Tokyo and Osaka.

Image credit: Image: File:Ferris Wheel - Port of Nagoya.JPG by Gnsin File:Higashiyama botanical gardens-01.jpg by KAMUI File:Nagoya (2015-11-03).JPG by Alpsdake File:Nagoya TV Tower.jpg by Benjamin Hollis upload by File Upload Bot (Magnus Manske) File:Nagoya csl snow piled up.jpg by 名古屋太郎 Composition by ASDFGH / Wikimedia Commons, CC BY-SA 3.0
Japan / East Asia
Use the Nagoya profile to compare cost framing, mobility, and industrial-economy signals alongside Tokyo and Osaka.

Image credit: Image: Hideki Uchida (セラ) / Wikimedia Commons, CC BY-SA 3.0
Japan / East Asia
Use the Sapporo profile to compare cost framing, mobility, and cold-climate-resilience signals alongside Tokyo and other Japanese metros.

Image credit: Image: Takuro1202 / Wikimedia Commons, CC BY-SA 3.0
Japan / East Asia
Use the Yokohama profile to compare affordability, livability, and economic indicators against other indexed cities in Japan and across East Asia, and to explore nearby nature and weekend destinations.

Image credit: Image: DXR / Wikimedia Commons, CC BY-SA 4.0
Japan / East Asia
Use the Hiroshima profile to compare affordability, livability, and economic indicators against other indexed cities in Japan and across East Asia, and to explore nearby nature and weekend destinations.

Image credit: Image: KENPEI / Wikimedia Commons, CC BY-SA 3.0
Japan / East Asia
Use the Kobe profile to compare affordability, livability, and economic indicators against other indexed cities in Japan and across East Asia, and to explore nearby nature and weekend destinations.

Image credit: Image: Tomio344456 / Wikimedia Commons, CC BY-SA 4.0
Japan / East Asia
Use the Nagasaki profile to compare affordability, livability, and economic indicators against other indexed cities in Japan and across East Asia, and to explore nearby nature and weekend destinations.
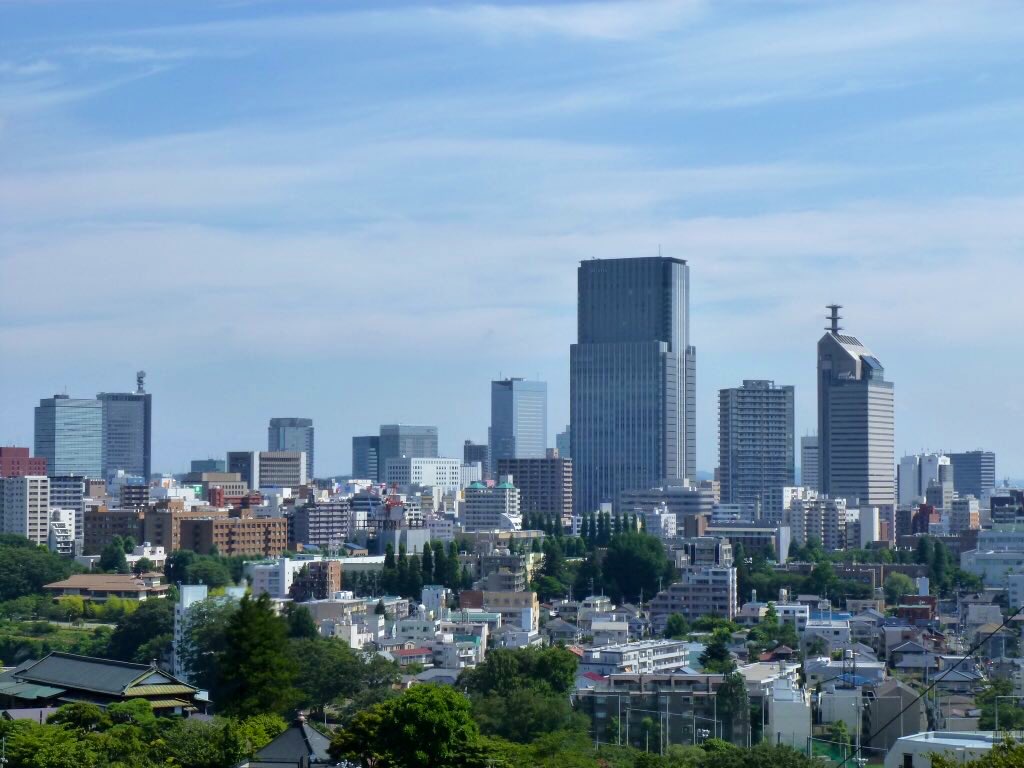
Image credit: Image: Nryate / Wikimedia Commons, CC BY-SA 4.0
Japan / East Asia
Use the Sendai profile to compare affordability, livability, and economic indicators against other indexed cities in Japan and across East Asia, and to explore nearby nature and weekend destinations.

Image credit: Image: Kurounmo / Wikimedia Commons, Public Domain
Japan / East Asia
Use the Saitama profile to compare affordability, livability, and economic indicators against other indexed cities in Japan and across East Asia, and to explore nearby nature and weekend destinations.

Image credit: Image: Hana Jp / Wikimedia Commons, CC BY-SA 2.0
Japan / East Asia
Use the Chiba profile to compare affordability, livability, and economic indicators against other indexed cities in Japan and across East Asia, and to explore nearby nature and weekend destinations.

Image credit: Image: 皓月旗 / Wikimedia Commons, CC BY-SA 4.0
Japan / East Asia
Use the Niigata profile to compare affordability, livability, and economic indicators against other indexed cities in Japan and across East Asia, and to explore nearby nature and weekend destinations.

Image credit: Image: Nihonsuku / Wikimedia Commons, CC BY-SA 3.0
Japan / East Asia
Use the Nagano profile to compare affordability, livability, and economic indicators against other indexed cities in Japan and across East Asia, and to explore nearby nature and weekend destinations.

Image credit: Image: Hisagi / Wikimedia Commons, CC BY-SA 3.0
Japan / East Asia
Use the Kumamoto profile to compare affordability, livability, and economic indicators against other indexed cities in Japan and across East Asia, and to explore nearby nature and weekend destinations.

Image credit: Image: Dariusz Jemielniak ("Pundit") / Wikimedia Commons, CC BY-SA 4.0
Japan / East Asia
Use the Nara profile to compare affordability, livability, and economic indicators against other indexed cities in Japan and across East Asia, and to explore nearby nature and weekend destinations.

Image credit: Image: Akahito Yamabe / Wikimedia Commons, CC BY-SA 4.0
Japan / East Asia
Use the Shizuoka profile to compare affordability, livability, and economic indicators against other indexed cities in Japan and across East Asia, and to explore nearby nature and weekend destinations.

Image credit: Image: kubotake / Wikimedia Commons, CC BY 2.0
Japan / East Asia
Use the Kagoshima profile to compare affordability, livability, and economic indicators against other indexed cities in Japan and across East Asia, and to explore nearby nature and weekend destinations.

Image credit: Image: 金沢市 / Wikimedia Commons, CC BY 2.1
Japan / East Asia
Use the Kanazawa profile to compare affordability, livability, and economic indicators against other indexed cities in Japan and across East Asia, and to explore nearby nature and weekend destinations.

Image credit: Image: Gazouya-japan / Wikimedia Commons, CC BY-SA 4.0
Japan / East Asia
Use the Kitakyūshū profile to compare affordability, livability, and economic indicators against other indexed cities in Japan and across East Asia, and to explore nearby nature and weekend destinations.

Image credit: Image: Tatushin / Wikimedia Commons, Public Domain
Japan / East Asia
Use the Okayama profile to compare affordability, livability, and economic indicators against other indexed cities in Japan and across East Asia, and to explore nearby nature and weekend destinations.

Image credit: Image: MIKI Yoshihito from Sapporo City,Hokkaido., JAPAN / Wikimedia Commons, CC BY 4.0
Japan / East Asia
Use the Kawasaki profile to compare affordability, livability, and economic indicators against other indexed cities in Japan and across East Asia, and to explore nearby nature and weekend destinations.
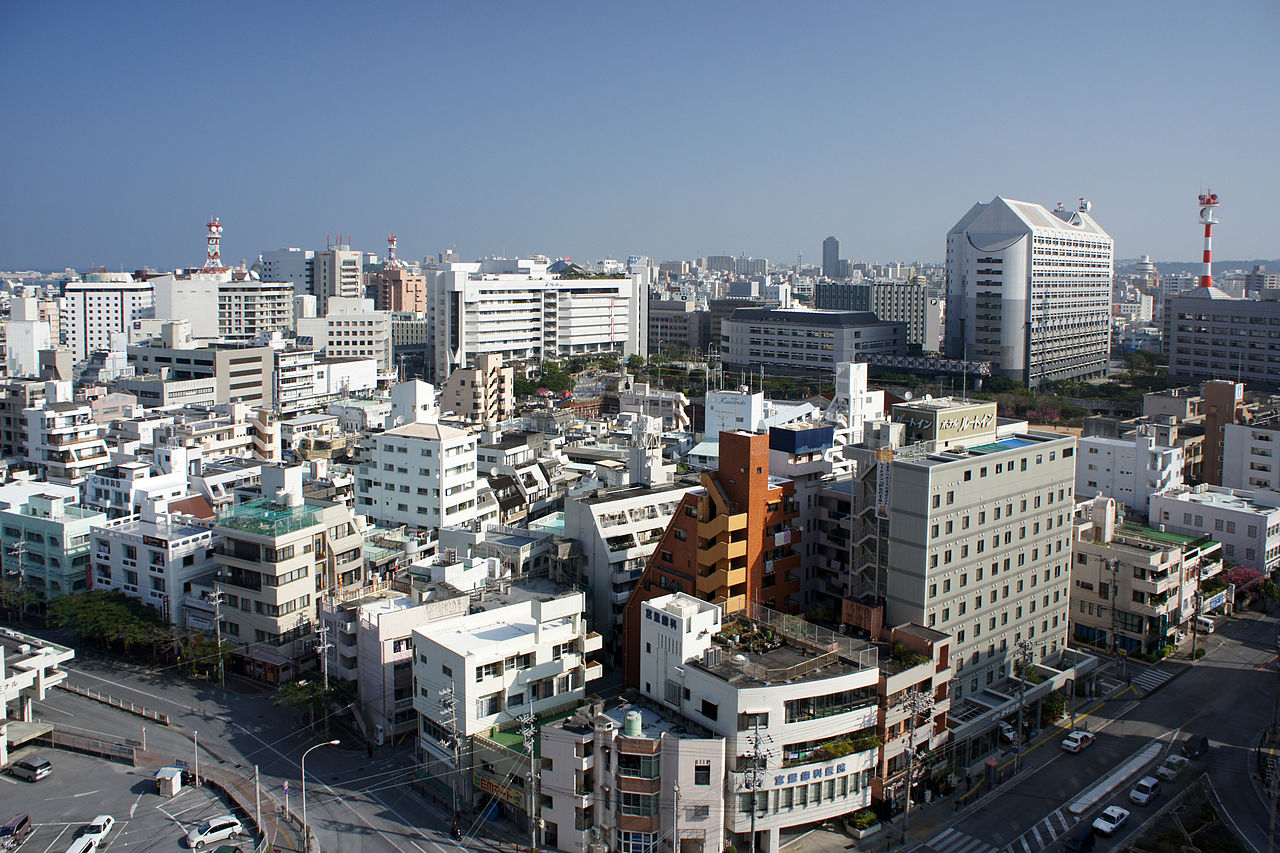
Image credit: Image: 663highland / Wikimedia Commons, CC BY 2.5
Japan / East Asia
Use the Naha profile to compare affordability, livability, and economic indicators against other indexed cities in Japan and across East Asia, and to explore nearby nature and weekend destinations.

Image credit: Image: redlegsfan21 / Wikimedia Commons, CC BY-SA 2.0
Japan / East Asia
Use the Matsuyama profile to compare affordability, livability, and economic indicators against other indexed cities in Japan and across East Asia, and to explore nearby nature and weekend destinations.

Image credit: Image: 掬茶 / Wikimedia Commons, CC BY-SA 4.0
Japan / East Asia
Use the Aomori profile to compare affordability, livability, and economic indicators against other indexed cities in Japan and across East Asia, and to explore nearby nature and weekend destinations.

Image credit: Image: Purplepumpkins / Wikimedia Commons, CC BY-SA 3.0
Japan / East Asia
Use the Fukushima profile to compare affordability, livability, and economic indicators against other indexed cities in Japan and across East Asia, and to explore nearby nature and weekend destinations.
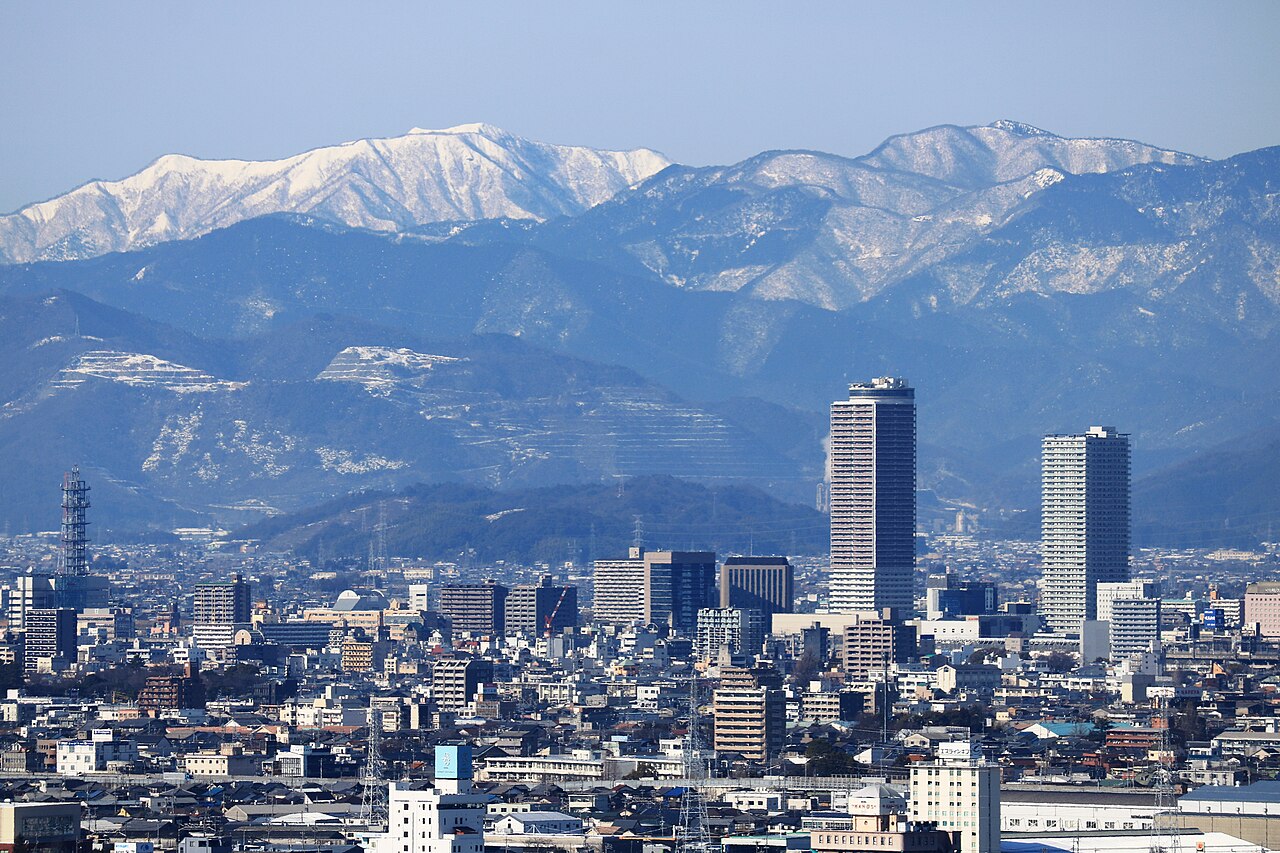
Image credit: Image: Alpsdake / Wikimedia Commons, CC BY-SA 4.0
Japan / East Asia
Use the Gifu profile to compare affordability, livability, and economic indicators against other indexed cities in Japan and across East Asia, and to explore nearby nature and weekend destinations.

Image credit: Image: 掬茶 / Wikimedia Commons, CC BY-SA 4.0
Japan / East Asia
Use the Akita profile to compare affordability, livability, and economic indicators against other indexed cities in Japan and across East Asia, and to explore nearby nature and weekend destinations.

Image credit: Image: 名古屋太郎 / Wikimedia Commons, CC BY-SA 3.0
Japan / East Asia
Use the Toyama profile to compare affordability, livability, and economic indicators against other indexed cities in Japan and across East Asia, and to explore nearby nature and weekend destinations.

Image credit: Image: Yuichi Shiraishi / Wikimedia Commons, CC BY-SA 4.0
Japan / East Asia
Use the Morioka profile to compare affordability, livability, and economic indicators against other indexed cities in Japan and across East Asia, and to explore nearby nature and weekend destinations.

Image credit: Image: ぼるるん / Wikimedia Commons, CC BY-SA 4.0
Japan / East Asia
Use the Ōita-shi profile to compare affordability, livability, and economic indicators against other indexed cities in Japan and across East Asia, and to explore nearby nature and weekend destinations.
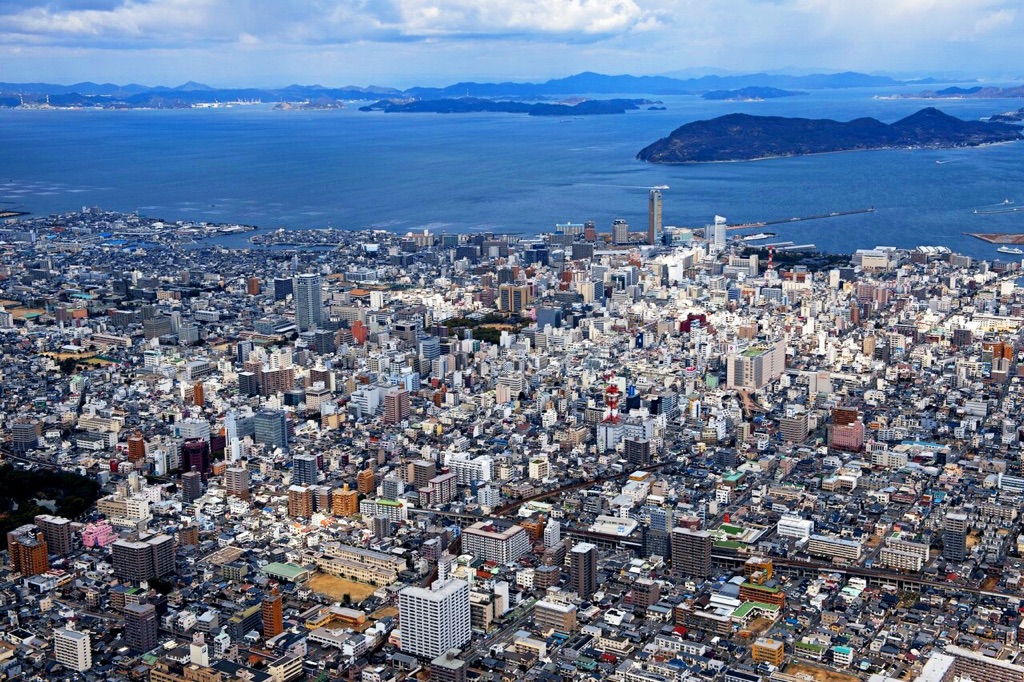
Image credit: Image: Arabrity / Wikimedia Commons, CC BY-SA 4.0
Japan / East Asia
Use the Takamatsu profile to compare affordability, livability, and economic indicators against other indexed cities in Japan and across East Asia, and to explore nearby nature and weekend destinations.

Image credit: Image: MaedaAkihiko / Wikimedia Commons, CC BY-SA 4.0
Japan / East Asia
Use the Utsunomiya profile to compare affordability, livability, and economic indicators against other indexed cities in Japan and across East Asia, and to explore nearby nature and weekend destinations.

Image credit: Image: 663highland / Wikimedia Commons, CC BY 2.5
Japan / East Asia
Use the Wakayama profile to compare affordability, livability, and economic indicators against other indexed cities in Japan and across East Asia, and to explore nearby nature and weekend destinations.

Image credit: Image: Gpwitteveen / Wikimedia Commons, CC BY-SA 4.0
Japan / East Asia
Use the Otsu profile to compare affordability, livability, and economic indicators against other indexed cities in Japan and across East Asia, and to explore nearby nature and weekend destinations.

Image credit: Image: ja:User:Sanjo / Wikimedia Commons, Public Domain
Japan / East Asia
Use the Miyazaki profile to compare affordability, livability, and economic indicators against other indexed cities in Japan and across East Asia, and to explore nearby nature and weekend destinations.

Image credit: Image: baggio4ever / Wikimedia Commons, CC BY 3.0
Japan / East Asia
Use the Kōchi-shi profile to compare affordability, livability, and economic indicators against other indexed cities in Japan and across East Asia, and to explore nearby nature and weekend destinations.

Image credit: Image: Javbw / Wikimedia Commons, CC BY 3.0
Japan / East Asia
Use the Maebashi profile to compare affordability, livability, and economic indicators against other indexed cities in Japan and across East Asia, and to explore nearby nature and weekend destinations.

Image credit: Image: 663highland / Wikimedia Commons, CC BY 2.5
Japan / East Asia
Use the Tokushima profile to compare affordability, livability, and economic indicators against other indexed cities in Japan and across East Asia, and to explore nearby nature and weekend destinations.

Image credit: Image: ::::=UT=:::: / Wikimedia Commons, CC BY-SA 3.0
Japan / East Asia
Use the Hakodate profile to compare affordability, livability, and economic indicators against other indexed cities in Japan and across East Asia, and to explore nearby nature and weekend destinations.

Image credit: Image: Σ64 / Wikimedia Commons, CC BY 4.0
Japan / East Asia
Use the Mito profile to compare affordability, livability, and economic indicators against other indexed cities in Japan and across East Asia, and to explore nearby nature and weekend destinations.

Image credit: Image: 663highland / Wikimedia Commons, CC BY-SA 4.0
Japan / East Asia
Use the Yamagata profile to compare affordability, livability, and economic indicators against other indexed cities in Japan and across East Asia, and to explore nearby nature and weekend destinations.

Image credit: Image: Syced / Wikimedia Commons, CC0
Japan / East Asia
Use the Hamamatsu profile to compare affordability, livability, and economic indicators against other indexed cities in Japan and across East Asia, and to explore nearby nature and weekend destinations.

Image credit: Image: Ik06 / Wikimedia Commons, CC0
Japan / East Asia
Use the Fukui profile to compare affordability, livability, and economic indicators against other indexed cities in Japan and across East Asia, and to explore nearby nature and weekend destinations.

Image credit: Image: SRIA / Wikimedia Commons, CC BY-SA 4.0
Japan / East Asia
Use the Himeji profile to compare affordability, livability, and economic indicators against other indexed cities in Japan and across East Asia, and to explore nearby nature and weekend destinations.

Image credit: Image: nannohi / Wikimedia Commons, CC BY-SA 3.0
Japan / East Asia
Use the Saga profile to compare affordability, livability, and economic indicators against other indexed cities in Japan and across East Asia, and to explore nearby nature and weekend destinations.

Image credit: Image: houzyouhideyosi / Wikimedia Commons, CC BY-SA 3.0
Japan / East Asia
Use the Tsu profile to compare affordability, livability, and economic indicators against other indexed cities in Japan and across East Asia, and to explore nearby nature and weekend destinations.

Image credit: Image: 663highland / Wikimedia Commons, CC BY 2.5
Japan / East Asia
Use the Tottori profile to compare affordability, livability, and economic indicators against other indexed cities in Japan and across East Asia, and to explore nearby nature and weekend destinations.

Image credit: Image: 江戸村のとくぞう / Wikimedia Commons, CC BY-SA 4.0
Japan / East Asia
Use the Matsue profile to compare affordability, livability, and economic indicators against other indexed cities in Japan and across East Asia, and to explore nearby nature and weekend destinations.

Image credit: Image: 栗原 岳 (Gaku Kurihara) / Wikimedia Commons, CC BY-SA 4.0
Japan / East Asia
Use the Kofu profile to compare affordability, livability, and economic indicators against other indexed cities in Japan and across East Asia, and to explore nearby nature and weekend destinations.

Image credit: Image: 新幹線 / Wikimedia Commons, CC BY-SA 4.0
Japan / East Asia
Use the Yamaguchi profile to compare affordability, livability, and economic indicators against other indexed cities in Japan and across East Asia, and to explore nearby nature and weekend destinations.
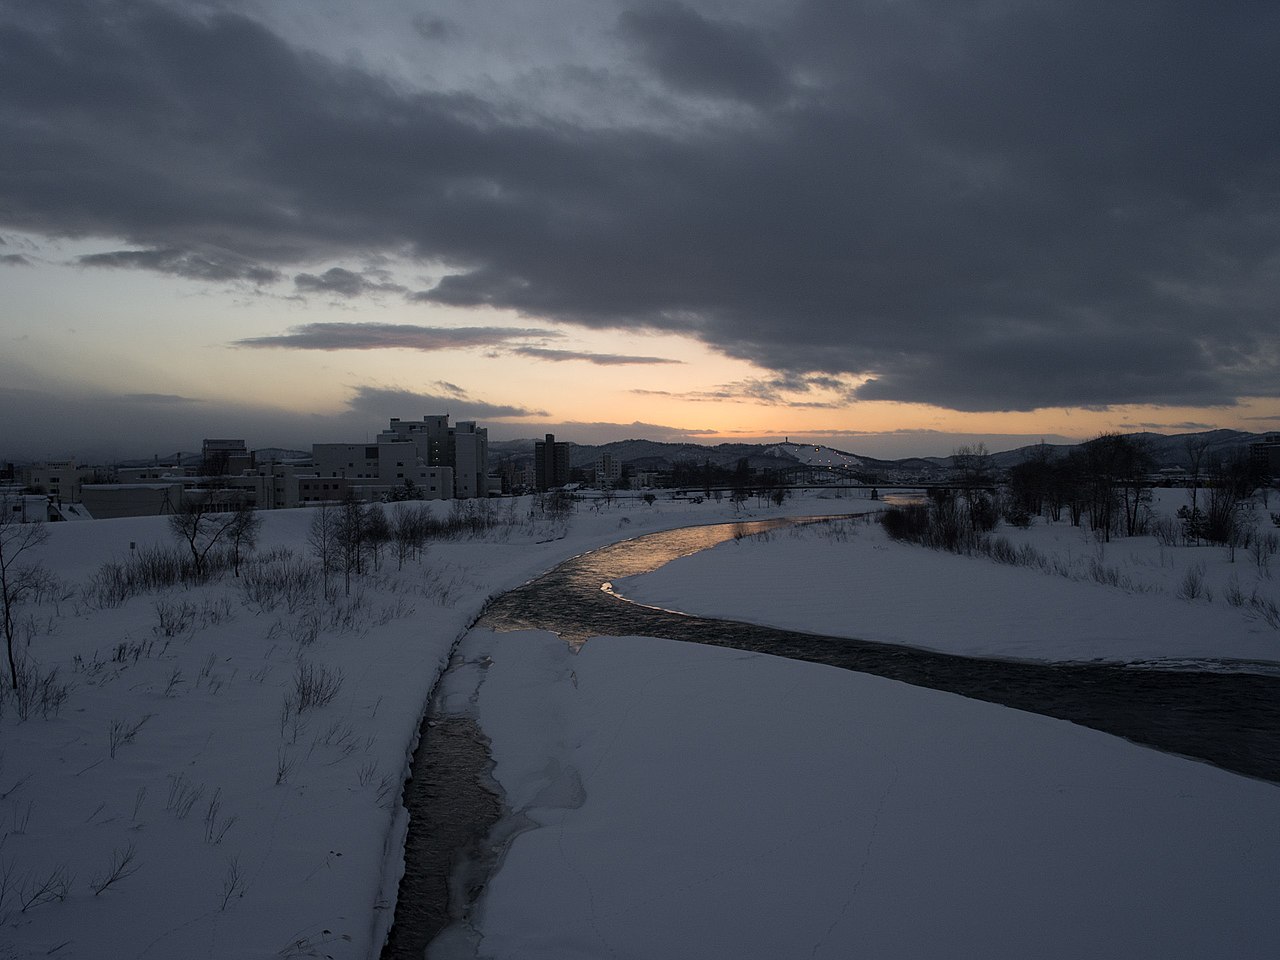
Image credit: Image: Ae Real / Wikimedia Commons, CC BY 3.0
Japan / East Asia
Use the Asahikawa profile to compare affordability, livability, and economic indicators against other indexed cities in Japan and across East Asia, and to explore nearby nature and weekend destinations.

Image credit: Image: Lombroso / Wikimedia Commons, CC BY-SA 3.0
Japan / East Asia
Use the Toyohashi profile to compare affordability, livability, and economic indicators against other indexed cities in Japan and across East Asia, and to explore nearby nature and weekend destinations.

Image credit: Image: Saigen Jiro / Wikimedia Commons, CC0
Japan / East Asia
Use the Sakai profile to compare affordability, livability, and economic indicators against other indexed cities in Japan and across East Asia, and to explore nearby nature and weekend destinations.

Image credit: Image: Olegushka / Wikimedia Commons, CC BY-SA 4.0
Japan / East Asia
Use the Okazaki profile to compare affordability, livability, and economic indicators against other indexed cities in Japan and across East Asia, and to explore nearby nature and weekend destinations.

Image credit: Image: Guilhem Vellut from Annecy, France / Wikimedia Commons, CC BY 2.0
Japan / East Asia
Use the Sagamihara profile to compare affordability, livability, and economic indicators against other indexed cities in Japan and across East Asia, and to explore nearby nature and weekend destinations.

Image credit: Image: ja:user:投稿者 / Wikimedia Commons, CC BY 3.0
Japan / East Asia
Use the Ichikawa profile to compare affordability, livability, and economic indicators against other indexed cities in Japan and across East Asia, and to explore nearby nature and weekend destinations.
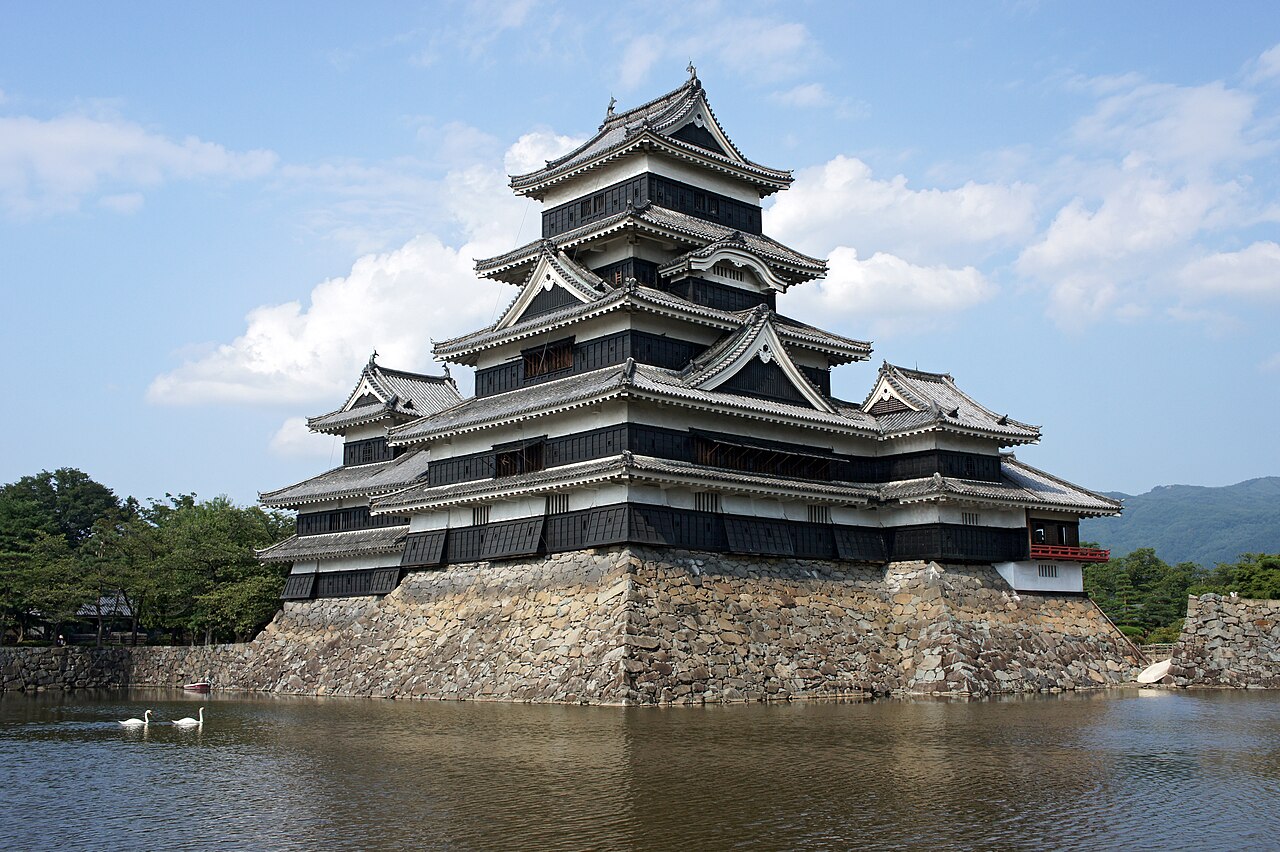
Image credit: Image: 663highland / Wikimedia Commons, CC BY 2.5
Japan / East Asia
Use the Matsumoto profile to compare affordability, livability, and economic indicators against other indexed cities in Japan and across East Asia, and to explore nearby nature and weekend destinations.

Image credit: Image: Tim Vickerman. Original / Wikimedia Commons, Public Domain
Japan / East Asia
Use the Kurume profile to compare affordability, livability, and economic indicators against other indexed cities in Japan and across East Asia, and to explore nearby nature and weekend destinations.
Image credit: Image: Angaurits / Wikimedia Commons, CC BY-SA 3.0
Japan / East Asia
Use the Hachinohe profile to compare affordability, livability, and economic indicators against other indexed cities in Japan and across East Asia, and to explore nearby nature and weekend destinations.

Image credit: Image: 武田信徳 / Wikimedia Commons, CC BY 4.0
Japan / East Asia
Use the Odawara profile to compare affordability, livability, and economic indicators against other indexed cities in Japan and across East Asia, and to explore nearby nature and weekend destinations.

Image credit: Image: Tomio344456 / Wikimedia Commons, CC BY-SA 4.0
Japan / East Asia
Use the Toyota profile to compare affordability, livability, and economic indicators against other indexed cities in Japan and across East Asia, and to explore nearby nature and weekend destinations.

Image credit: Image: carloshonda / Wikimedia Commons, CC BY 3.0
Japan / East Asia
Use the Suzuka profile to compare affordability, livability, and economic indicators against other indexed cities in Japan and across East Asia, and to explore nearby nature and weekend destinations.

Image credit: Image: halfrain / Wikimedia Commons, CC BY-SA 2.0
Japan / East Asia
Use the Akashi profile to compare affordability, livability, and economic indicators against other indexed cities in Japan and across East Asia, and to explore nearby nature and weekend destinations.

Image credit: Image: Kzaral / Wikimedia Commons, CC BY 2.0
Japan / East Asia
Use the Nagaoka profile to compare affordability, livability, and economic indicators against other indexed cities in Japan and across East Asia, and to explore nearby nature and weekend destinations.

Image credit: Image: ex-h20g-fan / Wikimedia Commons, CC BY 3.0
Japan / East Asia
Use the Yokosuka profile to compare affordability, livability, and economic indicators against other indexed cities in Japan and across East Asia, and to explore nearby nature and weekend destinations.

Image credit: Image: MAKIKO OMOKAWA / Wikimedia Commons, CC BY-SA 3.0
Japan / East Asia
Use the Hirosaki profile to compare affordability, livability, and economic indicators against other indexed cities in Japan and across East Asia, and to explore nearby nature and weekend destinations.

Image credit: Image: 663highland / Wikimedia Commons, CC BY 2.5
Japan / East Asia
Use the Amagasaki profile to compare affordability, livability, and economic indicators against other indexed cities in Japan and across East Asia, and to explore nearby nature and weekend destinations.

Image credit: Image: 663highland / Wikimedia Commons, CC BY-SA 4.0
Japan / East Asia
Use the Kamakura profile to compare affordability, livability, and economic indicators against other indexed cities in Japan and across East Asia, and to explore nearby nature and weekend destinations.

Image credit: Image: satoshi sawada from Obihiro, Japan / Wikimedia Commons, CC BY 2.0
Japan / East Asia
Use the Obihiro profile to compare affordability, livability, and economic indicators against other indexed cities in Japan and across East Asia, and to explore nearby nature and weekend destinations.
Image credit: Image: Wikimedia Commons contributor / Wikimedia Commons, Public Domain
Japan / East Asia
Use the Funabashi profile to compare affordability, livability, and economic indicators against other indexed cities in Japan and across East Asia, and to explore nearby nature and weekend destinations.

Image credit: Image: ノボホショコロトソ / Wikimedia Commons, CC BY 4.0
Japan / East Asia
Use the Yonago profile to compare affordability, livability, and economic indicators against other indexed cities in Japan and across East Asia, and to explore nearby nature and weekend destinations.

Image credit: Image: Nagono / Wikimedia Commons, CC BY-SA 3.0
Japan / East Asia
Use the Fukuyama profile to compare affordability, livability, and economic indicators against other indexed cities in Japan and across East Asia, and to explore nearby nature and weekend destinations.

Image credit: Image: Wikimedia Commons contributor / Wikimedia Commons, CC BY-SA 3.0
Japan / East Asia
Use the Takasaki profile to compare affordability, livability, and economic indicators against other indexed cities in Japan and across East Asia, and to explore nearby nature and weekend destinations.

Image credit: Image: 皓月旗 / Wikimedia Commons, CC BY-SA 4.0
Japan / East Asia
Use the Aizuwakamatsu profile to compare affordability, livability, and economic indicators against other indexed cities in Japan and across East Asia, and to explore nearby nature and weekend destinations.
Image credit: Image: ja:User:Sanjo / Wikimedia Commons, CC BY-SA 3.0
Japan / East Asia
Use the Shimonoseki profile to compare affordability, livability, and economic indicators against other indexed cities in Japan and across East Asia, and to explore nearby nature and weekend destinations.

Image credit: Image: KK77 / Wikimedia Commons, CC BY-SA 3.0
Japan / East Asia
Use the Iwata profile to compare affordability, livability, and economic indicators against other indexed cities in Japan and across East Asia, and to explore nearby nature and weekend destinations.

Image credit: Image: Yasu / Wikimedia Commons, CC BY-SA 3.0
Japan / East Asia
Use the Nishinomiya profile to compare affordability, livability, and economic indicators against other indexed cities in Japan and across East Asia, and to explore nearby nature and weekend destinations.

Image credit: Image: Ebiebi2 / Wikimedia Commons, Public Domain
Japan / East Asia
Use the Kawaguchi profile to compare affordability, livability, and economic indicators against other indexed cities in Japan and across East Asia, and to explore nearby nature and weekend destinations.

Image credit: Image: 663highland / Wikimedia Commons, CC BY-SA 4.0
Japan / East Asia
Use the Kurashiki profile to compare affordability, livability, and economic indicators against other indexed cities in Japan and across East Asia, and to explore nearby nature and weekend destinations.

Image credit: Image: Abasaa / Wikimedia Commons, Public Domain
Japan / East Asia
Use the Kashiwa profile to compare affordability, livability, and economic indicators against other indexed cities in Japan and across East Asia, and to explore nearby nature and weekend destinations.

Image credit: Image: Asturio Cantabrio / Wikimedia Commons, CC BY-SA 4.0
Japan / East Asia
Use the Marugame profile to compare affordability, livability, and economic indicators against other indexed cities in Japan and across East Asia, and to explore nearby nature and weekend destinations.

Image credit: Image: Akahito Yamabe / Wikimedia Commons, CC BY-SA 4.0
Japan / East Asia
Use the Fujieda profile to compare affordability, livability, and economic indicators against other indexed cities in Japan and across East Asia, and to explore nearby nature and weekend destinations.

Image credit: Image: Alpsdake / Wikimedia Commons, CC BY-SA 3.0
Japan / East Asia
Use the Kuwana profile to compare affordability, livability, and economic indicators against other indexed cities in Japan and across East Asia, and to explore nearby nature and weekend destinations.

Image credit: Image: Kentagon / Wikimedia Commons, CC BY-SA 4.0
Japan / East Asia
Use the Kisarazu profile to compare affordability, livability, and economic indicators against other indexed cities in Japan and across East Asia, and to explore nearby nature and weekend destinations.

Image credit: Image: Oilstreet / Wikimedia Commons, CC BY 2.5
Japan / East Asia
Use the Hikone profile to compare affordability, livability, and economic indicators against other indexed cities in Japan and across East Asia, and to explore nearby nature and weekend destinations.

Image credit: Image: wongwt / Wikimedia Commons, CC BY-SA 2.0
Japan / East Asia
Use the Kawagoe profile to compare affordability, livability, and economic indicators against other indexed cities in Japan and across East Asia, and to explore nearby nature and weekend destinations.

Image credit: Image: Wiiii / Wikimedia Commons, CC BY-SA 3.0
Japan / East Asia
Use the Sakura profile to compare affordability, livability, and economic indicators against other indexed cities in Japan and across East Asia, and to explore nearby nature and weekend destinations.

Image credit: Image: Bariston / Wikimedia Commons, CC BY-SA 4.0
Japan / East Asia
Use the Kariya profile to compare affordability, livability, and economic indicators against other indexed cities in Japan and across East Asia, and to explore nearby nature and weekend destinations.

Image credit: Image: Eurotuber / Wikimedia Commons, CC BY-SA 3.0
Japan / East Asia
Use the Matsudo profile to compare affordability, livability, and economic indicators against other indexed cities in Japan and across East Asia, and to explore nearby nature and weekend destinations.

Image credit: Image: Asturio Cantabrio / Wikimedia Commons, CC BY-SA 4.0
Japan / East Asia
Use the Ichinomiya profile to compare affordability, livability, and economic indicators against other indexed cities in Japan and across East Asia, and to explore nearby nature and weekend destinations.

Image credit: Image: Thomas Woodtli from Zürich, Switzerland / Wikimedia Commons, CC BY-SA 2.0
Japan / East Asia
Use the Karatsu profile to compare affordability, livability, and economic indicators against other indexed cities in Japan and across East Asia, and to explore nearby nature and weekend destinations.

Image credit: Image: ジェイ.ケイ ( J.K at Japanese Wikipedia ) / Wikimedia Commons, CC BY-SA 4.0
Japan / East Asia
Use the Fujisawa profile to compare affordability, livability, and economic indicators against other indexed cities in Japan and across East Asia, and to explore nearby nature and weekend destinations.

Image credit: Image: 藍原あおい / Wikimedia Commons, CC BY-SA 4.0
Japan / East Asia
Use the Kōriyama profile to compare affordability, livability, and economic indicators against other indexed cities in Japan and across East Asia, and to explore nearby nature and weekend destinations.

Image credit: Image: Hasec / Wikimedia Commons, Public Domain
Japan / East Asia
Use the Higashiōsaka-shi profile to compare affordability, livability, and economic indicators against other indexed cities in Japan and across East Asia, and to explore nearby nature and weekend destinations.

Image credit: Image: Altomarina / Wikimedia Commons, CC BY-SA 3.0
Japan / East Asia
Use the Iwaki profile to compare affordability, livability, and economic indicators against other indexed cities in Japan and across East Asia, and to explore nearby nature and weekend destinations.
Image credit: Image: Asturio Cantabrio / Wikimedia Commons, CC BY-SA 4.0
Japan / East Asia
Use the Kasugai profile to compare affordability, livability, and economic indicators against other indexed cities in Japan and across East Asia, and to explore nearby nature and weekend destinations.

Image credit: Image: 鉄虫 / Wikimedia Commons, CC BY-SA 3.0
Japan / East Asia
Use the Suita profile to compare affordability, livability, and economic indicators against other indexed cities in Japan and across East Asia, and to explore nearby nature and weekend destinations.

Image credit: Image: Yamaguchi Yoshiaki from Japan / Wikimedia Commons, CC BY-SA 2.0
Japan / East Asia
Use the Ueda profile to compare affordability, livability, and economic indicators against other indexed cities in Japan and across East Asia, and to explore nearby nature and weekend destinations.

Image credit: Image: Batholith / Wikimedia Commons, Public Domain
Japan / East Asia
Use the Mishima profile to compare affordability, livability, and economic indicators against other indexed cities in Japan and across East Asia, and to explore nearby nature and weekend destinations.

Image credit: Image: Ebiebi2 / Wikimedia Commons, Public Domain
Japan / East Asia
Use the Koshigaya profile to compare affordability, livability, and economic indicators against other indexed cities in Japan and across East Asia, and to explore nearby nature and weekend destinations.

Image credit: Image: Ngresonance at English Wikipedia / Wikimedia Commons, Public Domain
Japan / East Asia
Use the Yokkaichi profile to compare affordability, livability, and economic indicators against other indexed cities in Japan and across East Asia, and to explore nearby nature and weekend destinations.

Image credit: Image: NISHIGUCHI,Masahiro ( nisiguti ) / Wikimedia Commons, CC BY-SA 3.0
Japan / East Asia
Use the Hirakata profile to compare affordability, livability, and economic indicators against other indexed cities in Japan and across East Asia, and to explore nearby nature and weekend destinations.

Image credit: Image: Altomarina / Wikimedia Commons, CC BY-SA 3.0
Japan / East Asia
Use the Koga profile to compare affordability, livability, and economic indicators against other indexed cities in Japan and across East Asia, and to explore nearby nature and weekend destinations.

Image credit: Image: 欅 (Keyaki) / Wikimedia Commons, CC BY-SA 3.0
Japan / East Asia
Use the Muroran profile to compare affordability, livability, and economic indicators against other indexed cities in Japan and across East Asia, and to explore nearby nature and weekend destinations.
Source-attributed country-level indicators for Japan, drawn from the World Bank Development Indicators. Use the cards and table together to compare scale, unit, and data year for each metric.
Country-level, not city-level
Indicators describe national context. Pair them with city profiles, comparisons, and verified utility layers (emergency, healthcare, transport) for local detail.
Source-attributed where available
Values come from the World Bank Development Indicators. Where no verified record exists, the platform shows a transparent fallback rather than a guessed number.
Different indicators, different years
Each record carries its own data year because publishers refresh indicators on their own cadence. The card and table both display the year alongside the value.
Context, not a ranking
Treat indicators as orientation, not as a leaderboard. The platform never claims any country is best, safest, cleanest, richest, healthiest, or most connected.
Read alongside city intelligence
Country indicators are most useful when combined with the city profiles in the country, the public-safety, healthcare, and transport sections, and the methodology and data-sources pages.
For full construction details, read the methodology page and the data sources registry.
National-level economic signals to read alongside city-level cost and services pages.
GDP per capita
VerifiedEconomic context only — not a cost-of-living score or a household-income measure.
Data year 2024 updated 2026-04-08
Unemployment rate
VerifiedModeled ILO labor-market context — not a guarantee of job availability for any specific worker.
Data year 2025 updated 2026-04-08
National scale and urbanisation context; pair with city profiles for local detail.
Population
VerifiedNational scale only — not a city population value or a measure of urban density.
Data year 2024 updated 2026-04-08
Urban population share
VerifiedShare of population living in urban areas — not a quality-of-life or urban-form measure.
Data year 2024 updated 2026-04-08
Connectivity context drawn from World Bank usage and subscription indicators.
Internet usage
VerifiedShare of population that uses the internet — not a measure of connection speed or quality.
Data year 2024 updated 2026-04-08
Fixed broadband subscriptions
VerifiedFixed broadband subscriptions per 100 people — not a measure of overall internet quality or speed.
Data year 2023 updated 2026-04-08
National health-system context; not a substitute for verified city-level healthcare layers.
Life expectancy
VerifiedNational health-context indicator — not individual health guidance.
Data year 2024 updated 2026-04-08
Health expenditure per capita
VerifiedPer-capita spending context — not a measure of healthcare quality or access for any individual.
Data year 2023 updated 2026-04-08
National emissions context; read separately from city-level air-quality data.
CO₂ emissions per capita
VerifiedNational emissions context — not a city-level air-quality measurement.
Data year 2024 updated 2026-04-08
| Indicator | Value | Unit | Data year | Status |
|---|---|---|---|---|
| Population | 123,975,371 | people | 2024 | Verified |
| Internet usage | 85.54 | percent | 2024 | Verified |
| Urban population share | 92.19 | percent | 2024 | Verified |
| GDP per capita | 32,487.08 | current US$ | 2024 | Verified |
| Life expectancy | 84.04 | years | 2024 | Verified |
| Health expenditure per capita | 3,638.19 | current US$ | 2023 | Verified |
| Unemployment rate | 2.45 | percent | 2025 | Verified |
| CO₂ emissions per capita | 7.84 | metric tons per capita | 2024 | Verified |
| Fixed broadband subscriptions | 38.63 | per 100 people | 2023 | Verified |
Global City Intelligence — country indicators dataset
VerifiedCountry indicator values appear in this section only after they are sourced from accepted publishers and validated at build time. Malformed records cannot ship to production.
Verified emergency contacts for Japan, drawn from official emergency services and government publishers. Use these as a starting point and confirm current details with local authorities before traveling or relocating.
| Service | Number | Notes |
|---|---|---|
| Police | 11024/7 | — |
| Ambulance and fire | 11924/7 | 119 routes to both fire and emergency medical services. |
| Fire and ambulance | 11924/7 | — |
Each emergency contact above is attributed to an official emergency service or government publisher. Confirm current numbers directly with these sources.
Used as the primary attribution for Japan's 110 police and 119 fire and ambulance emergency numbers.
Last verified: 2026-05-16
Methodology and the wider source registry are documented on the scoring methodology and data sources pages.
Verified national healthcare information for Japan, drawn from official government and public health publishers. This is informational only and does not provide medical advice.
Healthcare system
Universal statutory health insurance system overseen by the Ministry of Health, Labour and Welfare.
Official health portal
Emergency medical information
Call 119 for ambulance and fire services. Hospital availability and language support vary by city; municipal portals publish local information.
Insurance and access
Residents are required to enrol in statutory health insurance; visitors typically pay out-of-pocket and seek reimbursement through travel insurance.
Each entry above is attributed to an official government, public health, or recognised health-system publisher. Confirm current information directly with these sources.
Used as the primary attribution for Japanese public-health context.
Last verified: 2026-05-16
Related sections: emergency and public safety, scoring methodology, and data sources.
Verified national transport context for Japan, attributed to official transport ministries, national operators, and aviation authorities. This is informational only; routes, fares, and schedules change frequently — check the linked authorities for current details.
Public transport overview
Japan's transport policy is set by the Ministry of Land, Infrastructure, Transport and Tourism (MLIT). Major cities are served by multiple rail and metro operators coordinated by local and prefectural authorities.
National transport authority
Each entry above is attributed to an official transport authority, national operator, airport publisher, or government source. Confirm current information directly with these publishers.
Used as the primary attribution for Japanese national transport and aviation context.
Last verified: 2026-05-16
Related sections: emergency and public safety, healthcare and hospitals, cities directory, countries directory, scoring methodology, data sources.
Curated city-vs-city comparisons that include at least one city from Japan. Each link opens a comparison page with structured indicators across cost, safety, healthcare, transport, and country context.
Asia · Global hub comparison
Tokyo vs Singapore: Cost, Safety, Healthcare & Transport
Compare Tokyo and Singapore across cost of living, air quality, safety, healthcare, transport, and country context for Asia-Pacific business and relocation decisions.
Asia · Regional alternative
Seoul vs Tokyo: Cost, Safety, Healthcare & Transport
Compare Seoul and Tokyo across cost of living, air quality, safety, healthcare, transport, and country context for East Asian regional relocation.
Asia · Regional alternative
Osaka vs Kyoto: Cost, Safety, Healthcare & Transport
Compare Osaka and Kyoto across cost of living, air quality, safety, healthcare, transport, and country context for users weighing western Japan's two anchor cities.
Asia · Relocation
Fukuoka vs Osaka: Cost, Safety, Healthcare & Transport
Pair Fukuoka and Osaka for a Japanese cross-region comparison across cost framing, transport access, and country-level public-service context.
Curated city collections that include at least one Japan city. Each collection is a comparison-oriented shortlist, not an official ranking.
Public transport
A mobility-focused city collection comparing cities with useful public-transport context and verified transport or mobility profiles where available.
2 cities from Japan in this collection
Explore rankings where supported Japan city profiles appear. Use rankings as directional city intelligence, not an official government ranking.
Ranking
A balanced ranking of cities across affordability, air quality, clean-energy readiness, and resilience.
106 cities from Japan appears in this ranking
Ranking
Cities that combine strong services, mobility, safety, clean air, and resilience into a healthy day-to-day profile.
106 cities from Japan appears in this ranking
Ranking
Cities that combine fast connectivity, safety, healthy day-to-day life, and a manageable cost-of-living balance for remote and hybrid workers.
106 cities from Japan appears in this ranking
Ranking
A health-oriented comparison of city air-quality scores using WHO-centered pollutant interpretation.
106 cities from Japan appears in this ranking
Ranking
Cities ranked by cost-of-living score, weighing housing pressure, essential spending, and household offsets across global metros.
106 cities from Japan appears in this ranking
Ranking
Cities ranked by internet speed, mobile coverage, and digital-readiness depth for residents, businesses, and remote workers.
106 cities from Japan appears in this ranking
Ranking
A ranking of city energy-transition readiness, grid resilience, clean-resource potential, and adaptation capacity.
106 cities from Japan appears in this ranking
Ranking
A practical affordability ranking that weighs housing pressure against transport access, services, and opportunity density.
106 cities from Japan appears in this ranking
See the full rankings directory for every available structured ranking.
Across 106 indexed cities, Tokyo leads at 89/100 and Hirakata sits at 78/100. Use the country page as a parent context layer; module-level detail lives on each city profile. Data year 2025; last updated 2026-05-16. Drawn from 4 institutional references.
Structured indicators on this hub are directional and intended for orientation. Verified utility layers — emergency, healthcare, transport — are attributed to official publishers where available and use transparent fallback states where verified country-level data is not yet integrated.
Structured indicators on this page are directional and intended for orientation. Verified datasets are being integrated; official sources should be used for critical decisions.
4 institutional references inform this view, listed below with reliability notes. Structured indicators on this page are directional and intended for orientation; verified datasets are being integrated and official sources should be used for critical decisions.
Used as a policy and methodology reference for urban exposure and resilience signals.
Used as an energy-resource and weather-normalization reference.
Used to normalize air-quality indicators toward health-protective benchmarks.
Used to explain urban climate vulnerability and adaptation scoring logic.