Supported cities
40
City profiles indexed for Netherlands.
Western Europe
The Netherlands combines compact transit-oriented cities, advanced water-management engineering, and steady renewable-energy progress into a stable urban operating environment. Netherlands is indexed at the country level in Western Europe, with 40 city profiles linked below.

Image credit: Image: Dominicus Johannes Bergsma / Wikimedia Commons, CC BY-SA 4.0
Additional verified imagery for Netherlands. Each photo is sourced from Wikimedia Commons with full attribution and a permissive license.

Keukenhof
Image credit: Image: Balou46 / Wikimedia Commons, CC BY-SA 3.0
Snapshot of structured Netherlands city intelligence and which verified utility layers are available on this hub.
Supported cities
40
City profiles indexed for Netherlands.
Emergency profile
Verified
Country emergency contacts attributed to official publishers.
Healthcare profile
Verified
Healthcare layer attributed to official health authorities.
Transport profile
Verified
Transport authority and operator references attributed to official sources.
Related comparisons
3
Curated city-vs-city comparison pages that reference this country.
Related collections
4
Best Cities collections that include at least one city from this country.
Data year
2025
Reference year for the country intelligence dataset.
Last updated
2026-05-16
Most recent platform-side review of the country hub.
World-class
Long-horizon flood and water-management programs shape national resilience.
Mature
Urban form and policy support car-light daily life across major metros.
High transparency
European monitoring supports pollutant comparison and health framing.
Country pages group cities into crawlable clusters and give national context without replacing city-level comparisons.
| Metric | Value | Context |
|---|---|---|
| Region | Western Europe | Used for geographic clustering and regional comparisons. |
| Indexed cities | 40 | Amstelveen, Venlo, Hilversum, Roermond, Lelystad, Zoetermeer, Leeuwarden, Ede, Dordrecht, Westland, Alphen aan den Rijn, Apeldoorn, Amersfoort, Zaanstad, Haarlemmermeer, Almere, 's-Hertogenbosch, Enschede, Amsterdam, Rotterdam, Utrecht, The Hague, Eindhoven, Groningen, Maastricht, Tilburg, Breda, Leiden, Delft, Nijmegen, Haarlem, Arnhem, Zwolle, Helmond, Purmerend, Hengelo, Schiedam, Roosendaal, Vlaardingen, Assen |
| Water adaptation | World-class | Long-horizon flood and water-management programs shape national resilience. |
| Cycling infrastructure | Mature | Urban form and policy support car-light daily life across major metros. |
| Air-quality context | High transparency | European monitoring supports pollutant comparison and health framing. |
Each linked city page includes its own metadata, data table, source block, module links, and any verified utility layers.

Image credit: Image: Vincent Steenberg / Wikimedia Commons, CC BY-SA 3.0
Netherlands / Western Europe
Use the Amstelveen profile to compare relocation context, transport access, and cost framing alongside regional peers such as Amsterdam, Haarlem, and Leiden.

Image credit: Image: Michiel1972 / Wikimedia Commons, CC BY 2.5
Netherlands / Western Europe
Use the Venlo profile to compare cross-border logistics, transport access, and cost framing alongside regional peers such as Eindhoven, Nijmegen, and Maastricht.

Image credit: Image: FaceMePLS from The Hague, The Netherlands / Wikimedia Commons, CC BY 2.0
Netherlands / Western Europe
Use the Hilversum profile to compare media-economy context, transport access, and air quality alongside regional peers such as Amsterdam, Utrecht, and Amersfoort.

Image credit: Image: This media file was made by Michiel1972 You may use it using a redistributable license (cc-by-sa), see below Please credit this : M.M.Minderhoud or Wikipedia/Michiel1972 / Wikimedia Commons, CC BY-SA 3.0
Netherlands / Western Europe
Use the Roermond profile to compare cross-border travel context, tourism demand, and cost framing alongside regional peers such as Maastricht, Eindhoven, and Nijmegen.
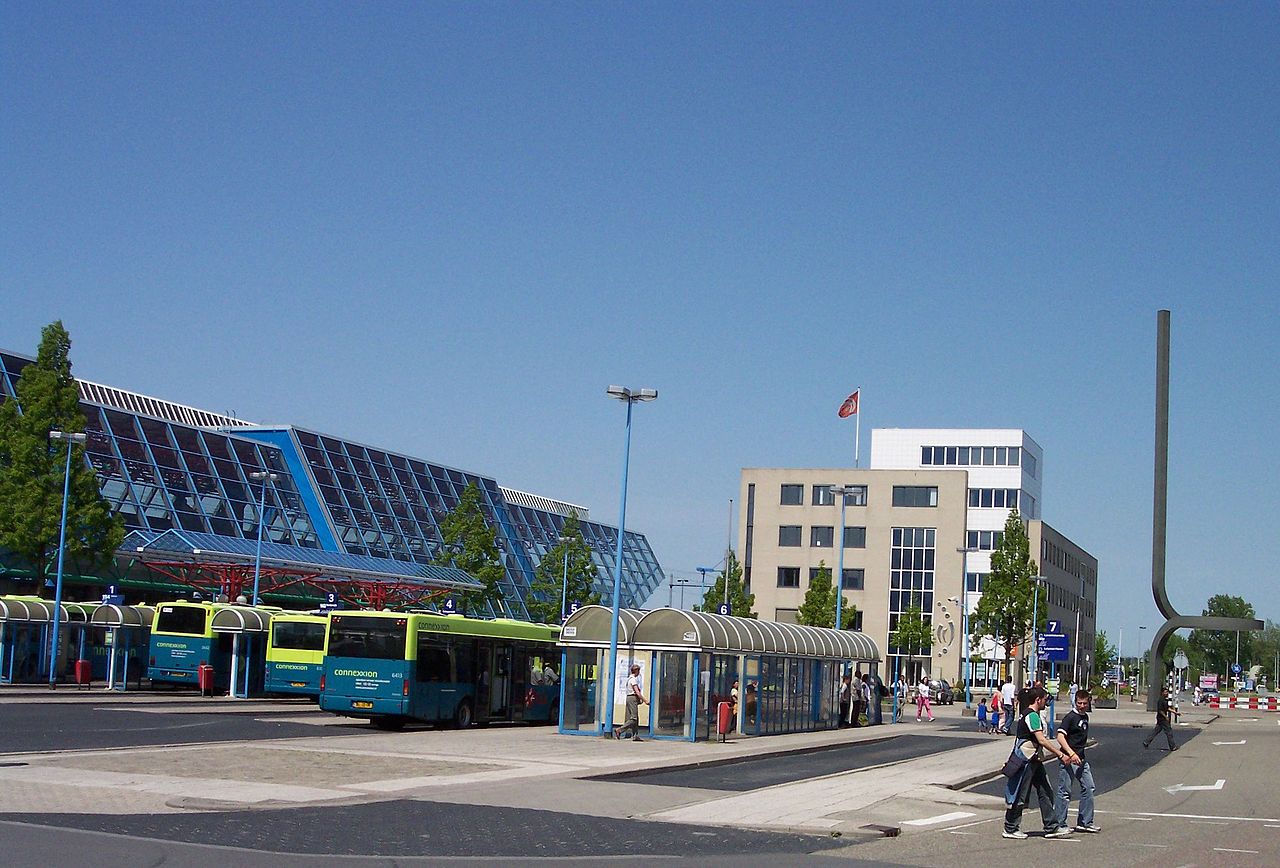
Image credit: Image: Stahlkocher / Wikimedia Commons, CC BY-SA 3.0
Netherlands / Western Europe
Use the Lelystad profile to compare administrative role, transport access, and climate-adaptation context alongside regional peers such as Amsterdam, Utrecht, and Amersfoort.

Image credit: Image: FaceMePLS from The Hague, The Netherlands / Wikimedia Commons, CC BY 2.0
Netherlands / Western Europe
Use the Zoetermeer profile to compare transport access, cost framing, and air quality alongside regional peers such as The Hague, Delft, and Leiden.

Image credit: Image: C messier / Wikimedia Commons, CC BY-SA 4.0
Netherlands / Western Europe
Use the Leeuwarden profile to compare affordability, healthcare framing, and transport access alongside regional peers such as Groningen, Zwolle, and Apeldoorn.

Image credit: Image: No machine-readable author provided. Rasbak assumed (based on copyright claims). / Wikimedia Commons, CC BY-SA 3.0
Netherlands / Western Europe
Use the Ede profile to compare affordability, air quality, and transport access alongside regional peers such as Arnhem, Apeldoorn, and Amersfoort.

Image credit: Image: Michiel Verbeek / Wikimedia Commons, CC BY-SA 3.0
Netherlands / Western Europe
Use the Dordrecht profile to compare climate-adaptation context, transport access, and cost framing alongside regional peers such as Rotterdam, Breda, and Tilburg.

Image credit: Image: Quistnix / Wikimedia Commons, CC BY 1.0
Netherlands / Western Europe
Use the Westland profile to compare industrial profile, energy framing, and climate-adaptation context alongside regional peers such as The Hague, Delft, and Rotterdam.

Image credit: Image: Linden, P.J., van der (Primaire vervaardiger) / Wikimedia Commons, CC0
Netherlands / Western Europe
Use the Alphen aan den Rijn profile to compare transport access, cost framing, and air quality alongside regional peers such as Leiden, Utrecht, and Haarlem.

Image credit: Image: nl:Gebruiker:GerardM / Wikimedia Commons, CC BY-SA 3.0
Netherlands / Western Europe
Use the Apeldoorn profile to compare affordability, air quality, and transport access alongside regional peers such as Arnhem, Nijmegen, and Zwolle.
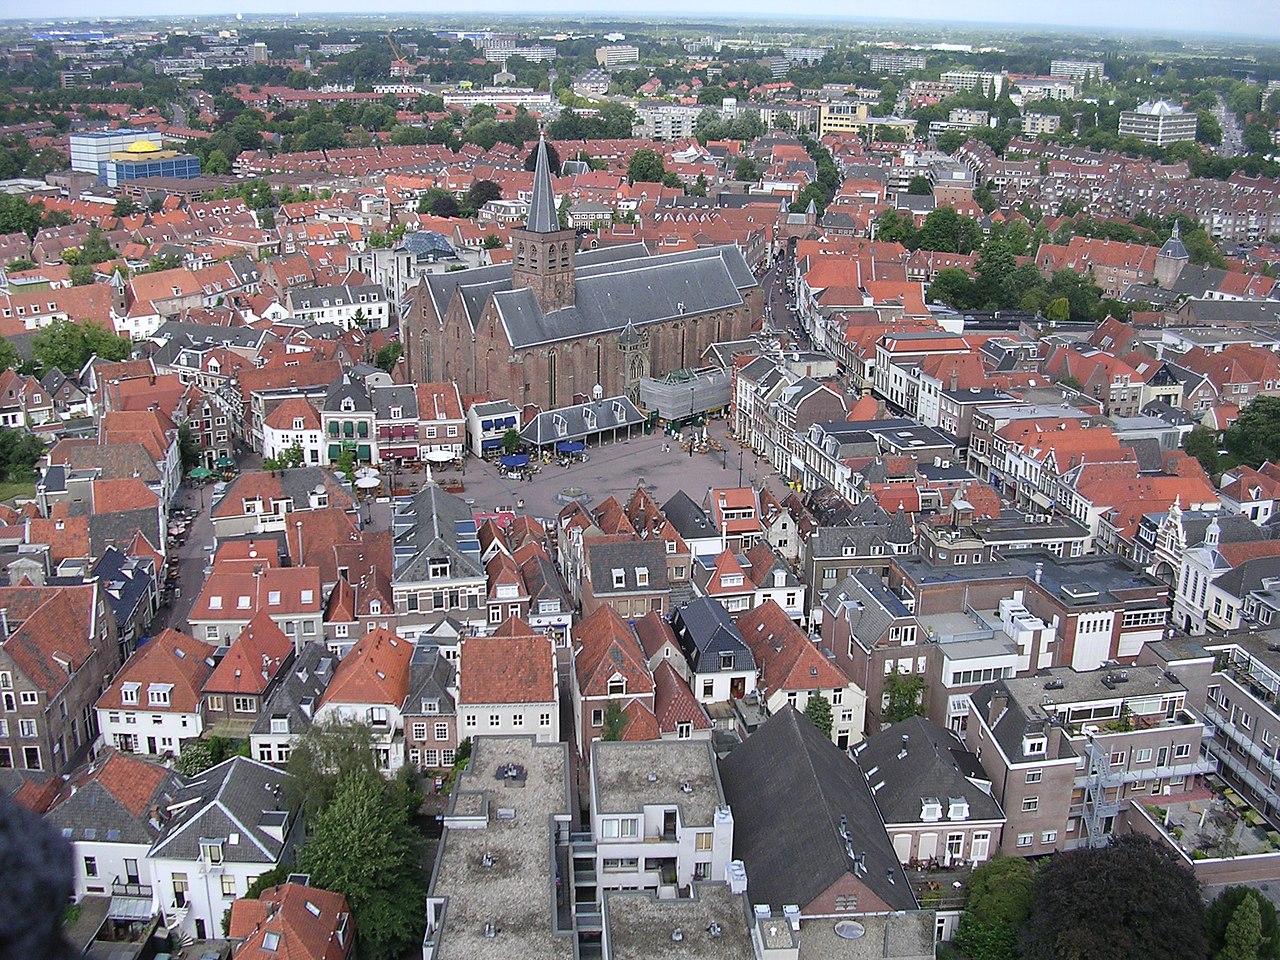
Image credit: Image: MelvinvdC at Dutch Wikipedia / Wikimedia Commons, CC BY-SA 3.0
Netherlands / Western Europe
Use the Amersfoort profile to compare cost framing, transport access, and air quality alongside regional peers such as Utrecht, Zwolle, and Arnhem.

Image credit: Image: WinkelmannZ / Wikimedia Commons, CC BY-SA 3.0
Netherlands / Western Europe
Use the Zaanstad profile to compare affordability, industrial profile, and transport access alongside regional peers such as Amsterdam, Haarlem, and Almere.
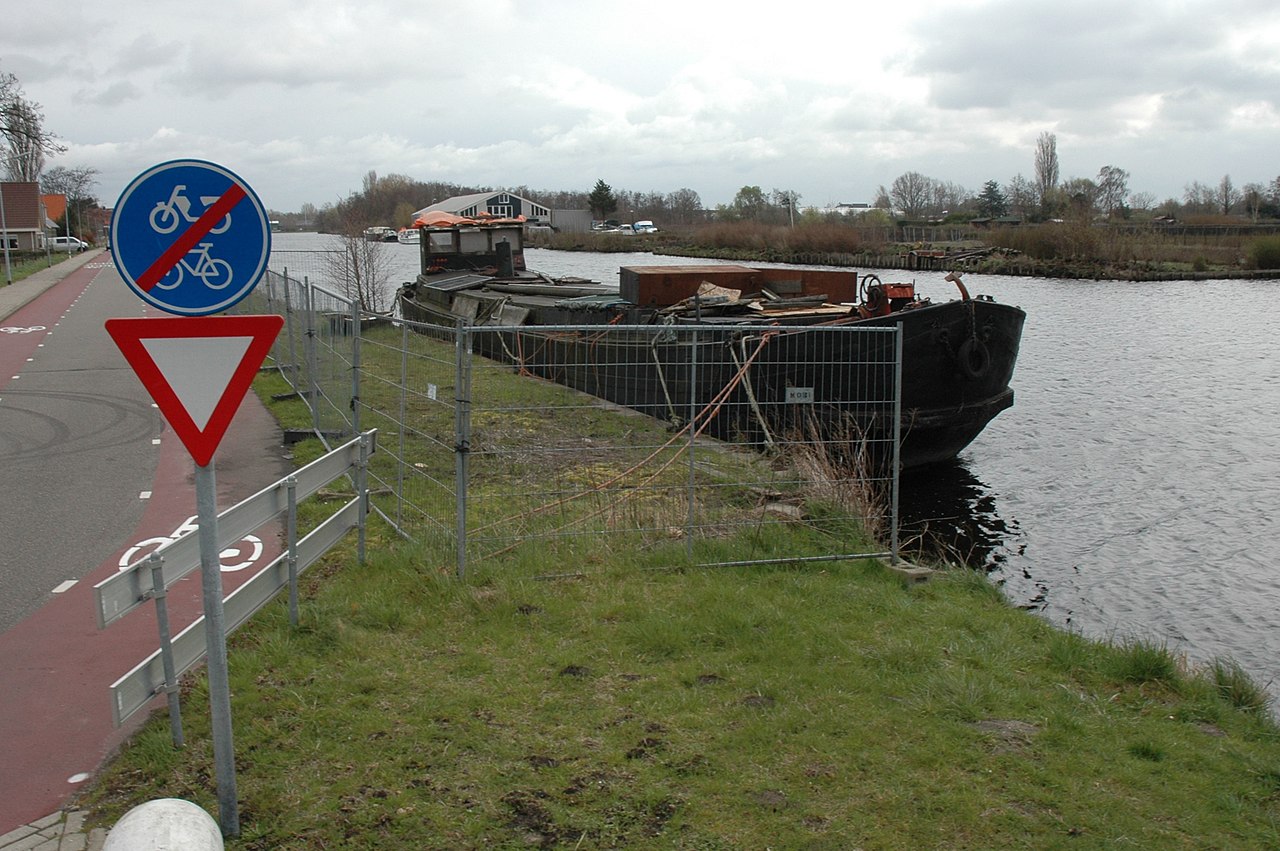
Image credit: Image: Han Jongeneel / Wikimedia Commons, CC BY 3.0
Netherlands / Western Europe
Use the Haarlemmermeer profile to compare transport access, climate-adaptation context, and cost framing alongside regional peers such as Amsterdam, Haarlem, and Leiden.
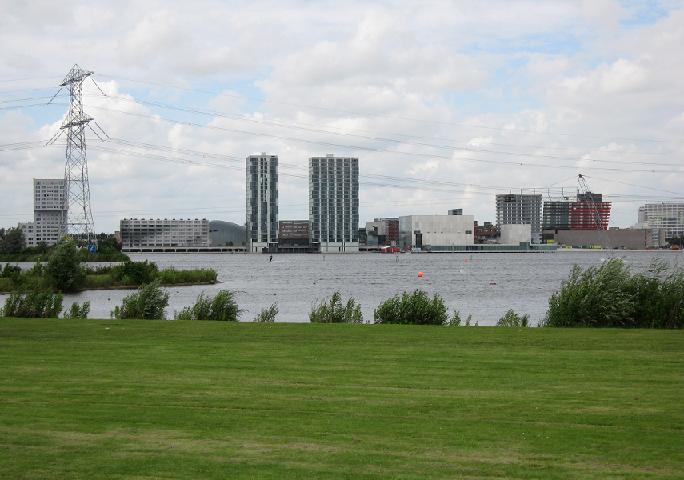
Image credit: Image: Bartholomeusll at Dutch Wikipedia (Original text: Bart Winkelhuijzen) / Wikimedia Commons, CC BY-SA 3.0
Netherlands / Western Europe
Use the Almere profile to compare affordability framing, transport access, and water-management resilience context alongside Amsterdam and other Randstad-edge cities.

Image credit: Image: Beckstet / Wikimedia Commons, CC BY-SA 3.0
Netherlands / Western Europe
Use the 's-Hertogenbosch profile to compare cost framing, transport access, and provincial-capital context alongside Eindhoven, Tilburg, and Nijmegen.

Image credit: Image: Berteun Damman (I self) / Wikimedia Commons, Public domain
Netherlands / Western Europe
Use the Enschede profile to compare cost framing, transport access, and university-economy context alongside Groningen, Nijmegen, and Eindhoven.

Image credit: Image: Marco Almbauer / Wikimedia Commons, CC BY-SA 3.0
Netherlands / Western Europe
Amsterdam reads best as a high-trust, transit-and-cycle-first city where moderate cost pressure is offset by strong public services and thoughtful climate planning.
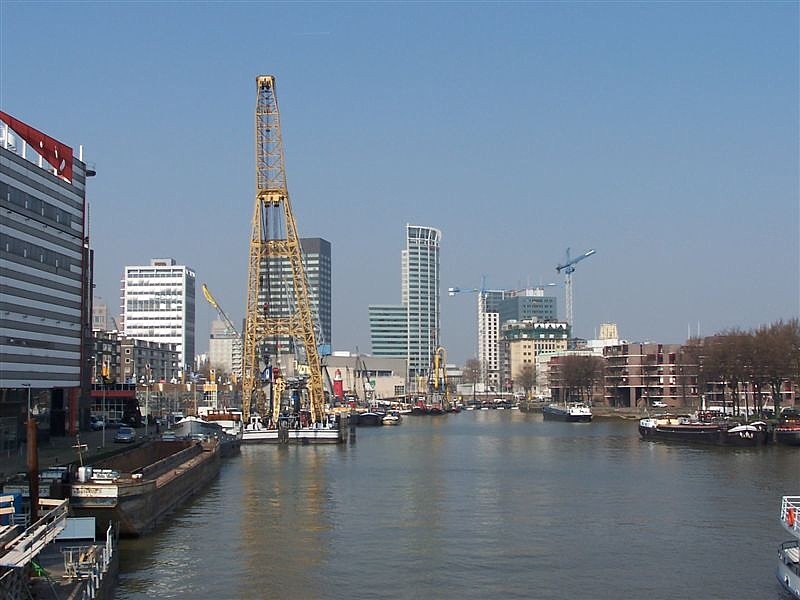
Image credit: Image: J.Donkervoort / Wikimedia Commons, CC BY-SA 2.0
Netherlands / Western Europe
Use the Rotterdam profile to compare cost framing, mobility, and delta-resilience signals alongside Amsterdam and other Northwest-European metros.

Image credit: Image: Pepijntje / Wikimedia Commons, CC BY-SA 3.0
Netherlands / Western Europe
Use the Utrecht profile to compare cost framing, mobility, and quality-of-life signals alongside Amsterdam and Rotterdam.

Image credit: Image: Jesterhat84 / Wikimedia Commons, CC BY-SA 3.0 nl
Netherlands / Western Europe
Use The Hague profile to compare cost framing, transport access, and country-level intelligence alongside Amsterdam and Rotterdam.

Image credit: Image: Arno van den Tillaart from Eindhoven, Netherlands / Wikimedia Commons, CC BY 2.0
Netherlands / Western Europe
Use the Eindhoven profile to compare cost framing, transport access, and country-level context alongside Amsterdam, Antwerp, and other Western-European tech metros.

Image credit: Image: Wenkbrauwalbatros / Wikimedia Commons, CC BY-SA 3.0
Netherlands / Western Europe
Use the Groningen profile to compare cost framing, transport access, and country-level context alongside other Dutch regional cores.
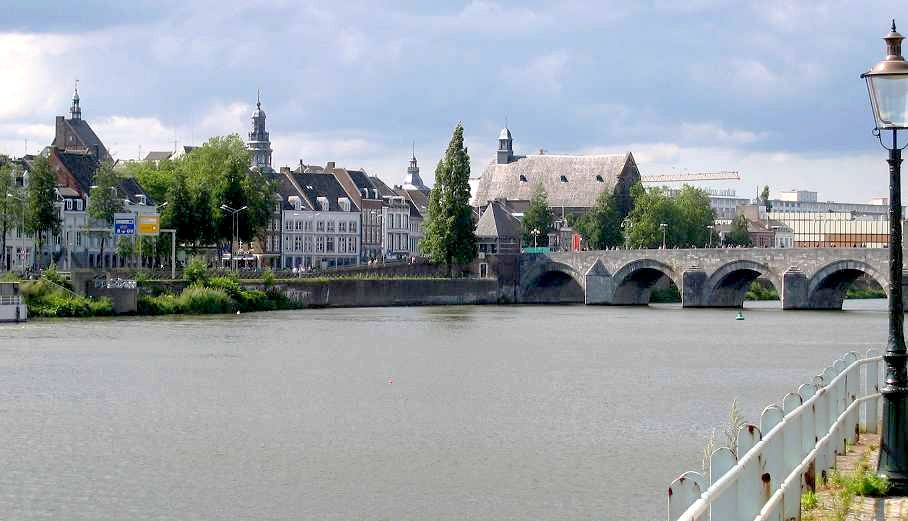
Image credit: Image: de:Benutzer:Mussklprozz / Wikimedia Commons, CC BY-SA 3.0
Netherlands / Western Europe
Use the Maastricht profile to compare cost framing, transport access, and country-level cross-border context alongside Liege and Aachen-area peers.

Image credit: Image: Reino Baptista at English Wikipedia / Wikimedia Commons, CC BY 3.0
Netherlands / Western Europe
Use this record as a regional planning anchor while deeper source integration is pending. Verify access, transport, and seasonal context with official sources before relying on the page for travel decisions.

Image credit: Image: M.Minderhoud / Wikimedia Commons, CC BY-SA 3.0
Netherlands / Western Europe
Use this record as a regional planning anchor while deeper source integration is pending. Verify access, transport, and seasonal context with official sources before relying on the page for travel decisions.

Image credit: Image: W. Bulach / Wikimedia Commons, CC BY-SA 4.0
Netherlands / South Holland
Use this record as a planning anchor for local-first research and nearby weekend-rest discovery, verifying access, transport, and seasonal context with official sources.

Image credit: Image: W. Bulach / Wikimedia Commons, CC BY-SA 4.0
Netherlands / South Holland
Use this record as a planning anchor for local-first research and nearby weekend-rest discovery, verifying access, transport, and seasonal context with official sources.

Image credit: Image: Szilas / Wikimedia Commons, CC BY-SA 4.0
Netherlands / Gelderland
Use this record as a planning anchor for local-first research and nearby weekend-rest discovery, verifying access, transport, and seasonal context with official sources.

Image credit: Image: Fryslan0109 at English Wikipedia / Wikimedia Commons, Public domain
Netherlands / North Holland
This record works as a planning anchor for local-first research and nearby weekend-rest discovery, with travellers advised to verify access, transport, and seasonal details through official sources.

Image credit: Image: Mackensen / Wikimedia Commons, Public domain
Netherlands / Gelderland
This record works as a planning anchor for local-first research and nearby weekend-rest discovery, with travellers advised to verify access, transport, and seasonal details through official sources.

Image credit: Image: Nummer 12 / Wikimedia Commons, CC BY-SA 3.0
Netherlands / Overijssel
This record works as a planning anchor for local-first research and nearby weekend-rest discovery, with travellers advised to verify access, transport, and seasonal details through official sources.

Image credit: Image: Geert C. Smulders at nl.wikipedia / Wikimedia Commons, CC BY-SA 3.0
Netherlands / Western Europe
Use the Helmond profile to compare affordability, livability, and economic indicators against other indexed cities in Netherlands and across Western Europe, and to explore nearby nature and weekend destinations.

Image credit: Image: Marjon from The Netherlands / Wikimedia Commons, CC BY-SA 2.0
Netherlands / Western Europe
Use the Purmerend profile to compare affordability, livability, and economic indicators against other indexed cities in Netherlands and across Western Europe, and to explore nearby nature and weekend destinations.

Image credit: Image: Michielverbeek / Wikimedia Commons, CC BY-SA 3.0 nl
Netherlands / Western Europe
Use the Hengelo profile to compare affordability, livability, and economic indicators against other indexed cities in Netherlands and across Western Europe, and to explore nearby nature and weekend destinations.

Image credit: Image: GraphyArchy / Wikimedia Commons, CC BY-SA 4.0
Netherlands / Western Europe
Use the Schiedam profile to compare affordability, livability, and economic indicators against other indexed cities in Netherlands and across Western Europe, and to explore nearby nature and weekend destinations.
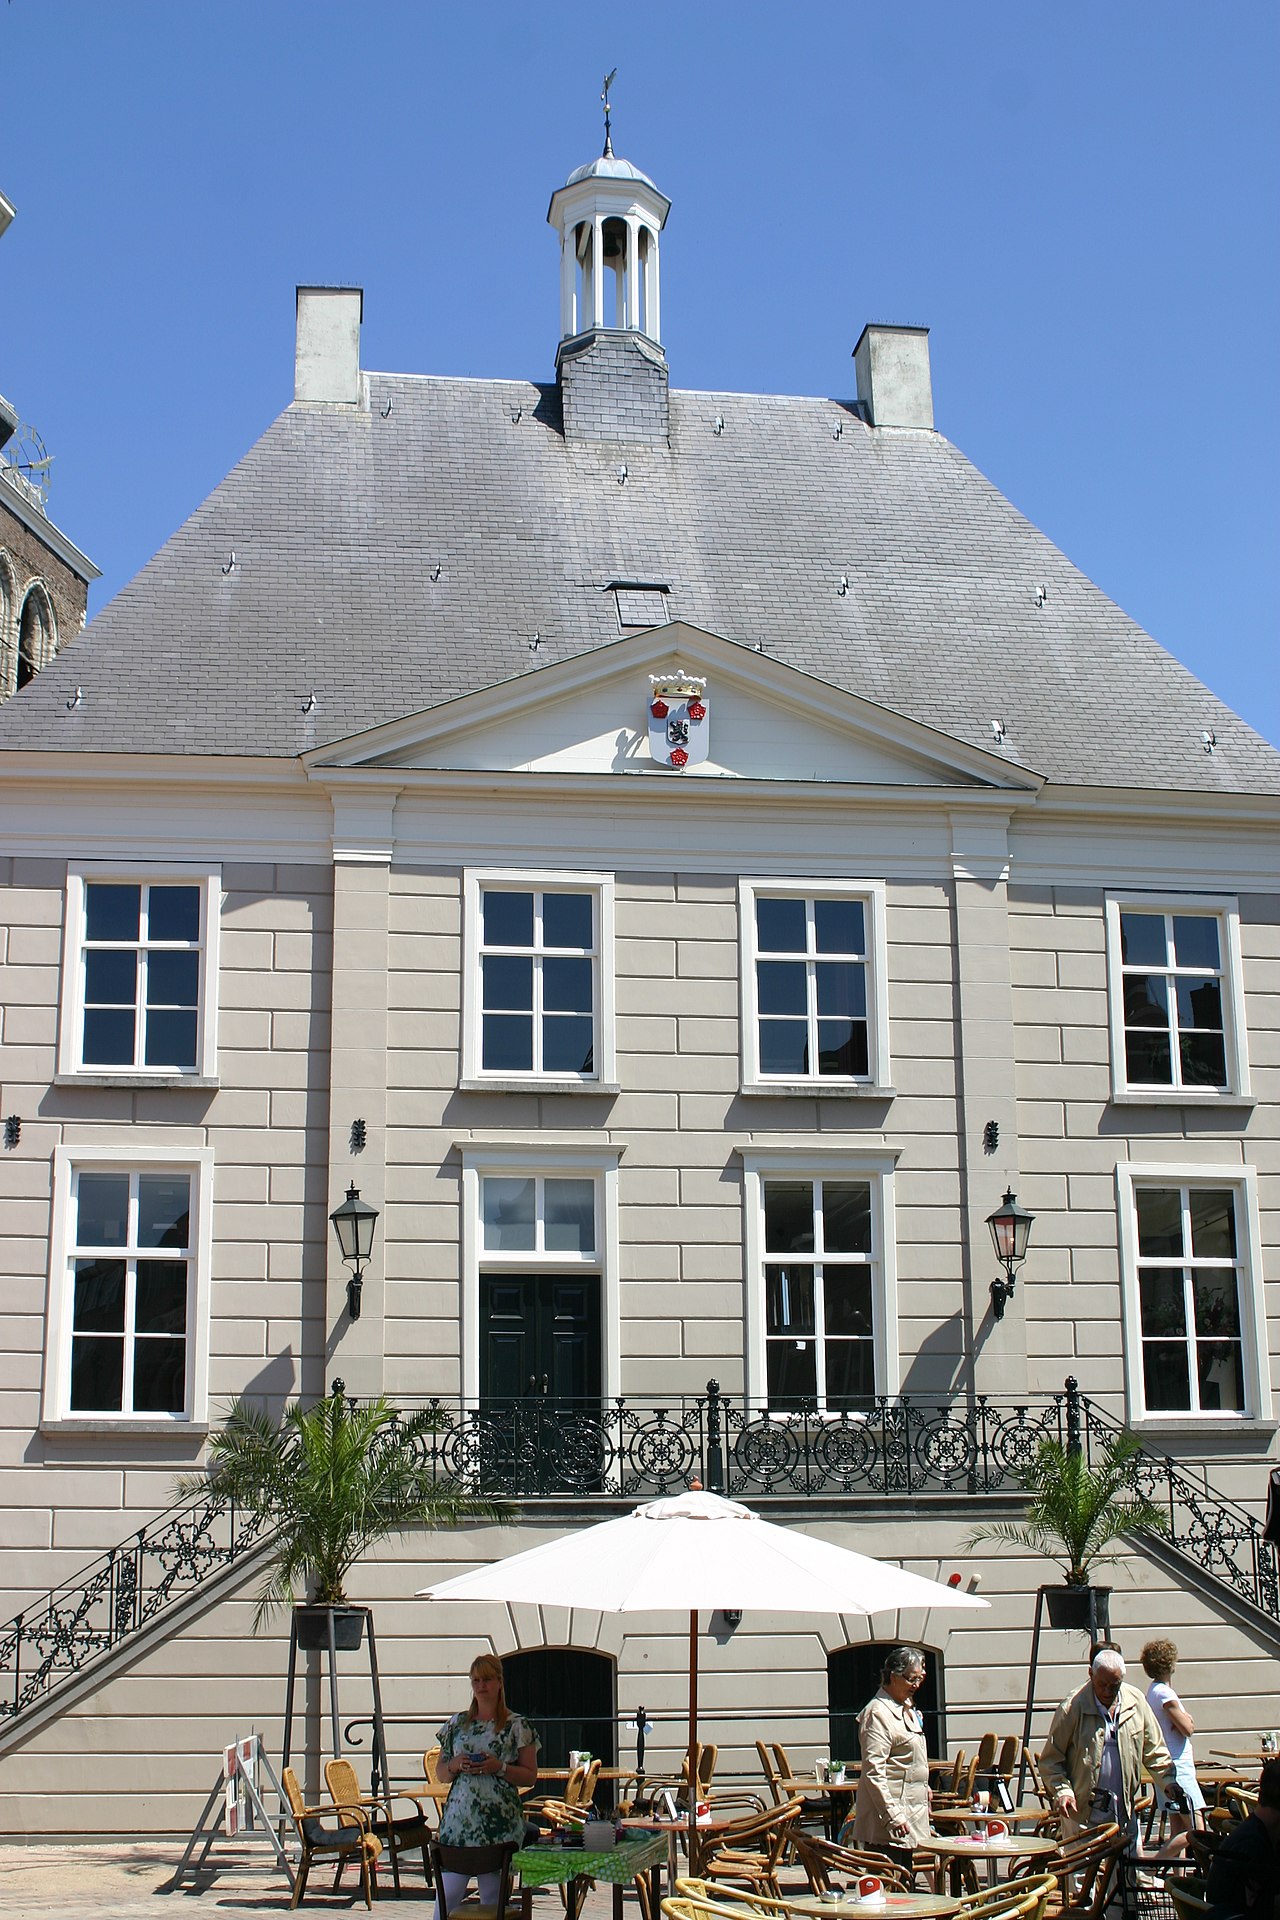
Image credit: Image: Goodness Shamrock / Wikimedia Commons, CC BY 3.0
Netherlands / Western Europe
Use the Roosendaal profile to compare affordability, livability, and economic indicators against other indexed cities in Netherlands and across Western Europe, and to explore nearby nature and weekend destinations.

Image credit: Image: M.Minderhoud / Wikimedia Commons, CC BY-SA 3.0
Netherlands / Western Europe
Use the Vlaardingen profile to compare affordability, livability, and economic indicators against other indexed cities in Netherlands and across Western Europe, and to explore nearby nature and weekend destinations.

Image credit: Image: Niels Elgaard Larsen / Wikimedia Commons, CC BY-SA 3.0
Netherlands / Western Europe
Use the Assen profile to compare affordability, livability, and economic indicators against other indexed cities in Netherlands and across Western Europe, and to explore nearby nature and weekend destinations.
Source-attributed country-level indicators for Netherlands, drawn from the World Bank Development Indicators. Use the cards and table together to compare scale, unit, and data year for each metric.
Country-level, not city-level
Indicators describe national context. Pair them with city profiles, comparisons, and verified utility layers (emergency, healthcare, transport) for local detail.
Source-attributed where available
Values come from the World Bank Development Indicators. Where no verified record exists, the platform shows a transparent fallback rather than a guessed number.
Different indicators, different years
Each record carries its own data year because publishers refresh indicators on their own cadence. The card and table both display the year alongside the value.
Context, not a ranking
Treat indicators as orientation, not as a leaderboard. The platform never claims any country is best, safest, cleanest, richest, healthiest, or most connected.
Read alongside city intelligence
Country indicators are most useful when combined with the city profiles in the country, the public-safety, healthcare, and transport sections, and the methodology and data-sources pages.
For full construction details, read the methodology page and the data sources registry.
National-level economic signals to read alongside city-level cost and services pages.
GDP per capita
VerifiedEconomic context only — not a cost-of-living score or a household-income measure.
Data year 2024 updated 2026-04-08
Unemployment rate
VerifiedModeled ILO labor-market context — not a guarantee of job availability for any specific worker.
Data year 2025 updated 2026-04-08
National scale and urbanisation context; pair with city profiles for local detail.
Population
VerifiedNational scale only — not a city population value or a measure of urban density.
Data year 2024 updated 2026-04-08
Urban population share
VerifiedShare of population living in urban areas — not a quality-of-life or urban-form measure.
Data year 2024 updated 2026-04-08
Connectivity context drawn from World Bank usage and subscription indicators.
Internet usage
VerifiedShare of population that uses the internet — not a measure of connection speed or quality.
Data year 2024 updated 2026-04-08
Fixed broadband subscriptions
VerifiedFixed broadband subscriptions per 100 people — not a measure of overall internet quality or speed.
Data year 2024 updated 2026-04-08
National health-system context; not a substitute for verified city-level healthcare layers.
Life expectancy
VerifiedNational health-context indicator — not individual health guidance.
Data year 2024 updated 2026-04-08
Health expenditure per capita
VerifiedPer-capita spending context — not a measure of healthcare quality or access for any individual.
Data year 2024 updated 2026-04-08
National emissions context; read separately from city-level air-quality data.
CO₂ emissions per capita
VerifiedNational emissions context — not a city-level air-quality measurement.
Data year 2024 updated 2026-04-08
| Indicator | Value | Unit | Data year | Status |
|---|---|---|---|---|
| Population | 17,993,485 | people | 2024 | Verified |
| Internet usage | 97.01 | percent | 2024 | Verified |
| Urban population share | 95.64 | percent | 2024 | Verified |
| GDP per capita | 67,520.42 | current US$ | 2024 | Verified |
| Life expectancy | 81.97 | years | 2024 | Verified |
| Health expenditure per capita | 6,845.14 | current US$ | 2024 | Verified |
| Unemployment rate | 3.87 | percent | 2025 | Verified |
| CO₂ emissions per capita | 6.6 | metric tons per capita | 2024 | Verified |
| Fixed broadband subscriptions | 42.98 | per 100 people | 2024 | Verified |
Global City Intelligence — country indicators dataset
VerifiedCountry indicator values appear in this section only after they are sourced from accepted publishers and validated at build time. Malformed records cannot ship to production.
Verified emergency contacts for Netherlands, drawn from official emergency services and government publishers. Use these as a starting point and confirm current details with local authorities before traveling or relocating.
| Service | Number | Notes |
|---|---|---|
| European emergency | 11224/7 | 112 reaches police, fire, and ambulance dispatch across the European Union from any phone, free of charge. |
Each emergency contact above is attributed to an official emergency service or government publisher. Confirm current numbers directly with these sources.
Used as the primary attribution for the EU-wide 112 universal emergency number on European country profiles.
Last verified: 2026-05-16
Methodology and the wider source registry are documented on the scoring methodology and data sources pages.
Verified national healthcare information for Netherlands, drawn from official government and public health publishers. This is informational only and does not provide medical advice.
Healthcare system
Statutory private health insurance system regulated by national law, with primary care delivered by huisartsen (GPs).
Official health portal
RIVM — National Institute for Public Health and the Environment
Emergency medical information
Call 112 for medical emergencies. The huisartsenpost (out-of-hours GP service) handles urgent non-emergency care.
Insurance and access
Residents are required to hold basic health insurance; visitors use EHIC, GHIC, or private travel insurance.
Each entry above is attributed to an official government, public health, or recognised health-system publisher. Confirm current information directly with these sources.
Used as the primary attribution for Dutch public-health context.
Last verified: 2026-05-16
Related sections: emergency and public safety, scoring methodology, and data sources.
Verified national transport context for Netherlands, attributed to official transport ministries, national operators, and aviation authorities. This is informational only; routes, fares, and schedules change frequently — check the linked authorities for current details.
Public transport overview
National transport policy is led by the Ministry of Infrastructure and Water Management. Principal passenger rail is operated by Nederlandse Spoorwegen (NS).
National transport authority
Rail authority or operator
Each entry above is attributed to an official transport authority, national operator, airport publisher, or government source. Confirm current information directly with these publishers.
Used as the primary federal attribution for Dutch national transport context.
Used as the primary attribution for Dutch national rail operator information.
Last verified: 2026-05-16
Related sections: emergency and public safety, healthcare and hospitals, cities directory, countries directory, scoring methodology, data sources.
Curated city-vs-city comparisons that include at least one city from Netherlands. Each link opens a comparison page with structured indicators across cost, safety, healthcare, transport, and country context.
Europe · Quality of life
Berlin vs Amsterdam: Cost, Safety, Healthcare & Transport
Compare Berlin and Amsterdam across cost of living, air quality, safety, healthcare, transport, emergency services, and country context with structured directional indicators.
Europe · Regional alternative
The Hague vs Rotterdam: Cost, Safety, Healthcare & Transport
Pair The Hague and Rotterdam for a Randstad comparison across cost framing, transport access, and country-level public-service context.
Europe · Regional alternative
Eindhoven vs Utrecht: Cost, Safety, Healthcare & Transport
Compare Eindhoven and Utrecht as Dutch regional cores across cost framing, transport access, and country-level indicators.
Curated city collections that include at least one Netherlands city. Each collection is a comparison-oriented shortlist, not an official ranking.
Remote work
A curated city intelligence shortlist for remote workers, comparing cities across cost context, safety, healthcare, transport, connectivity, and relocation utility — not an official ranking.
1 city from Netherlands in this collection
Family life
A comparison-oriented collection of cities seen through family-relevant context: safety, healthcare, public services, transport, air quality, and livability indicators. Designed for comparison, not as an official family ranking.
1 city from Netherlands in this collection
Startups
Compare cities with startup and business relevance through connectivity, infrastructure, transport, and international hub positioning. A curated shortlist, not an official ranking.
1 city from Netherlands in this collection
Public transport
A mobility-focused city collection comparing cities with useful public-transport context and verified transport or mobility profiles where available.
1 city from Netherlands in this collection
Explore rankings where supported Netherlands city profiles appear. Use rankings as directional city intelligence, not an official government ranking.
Ranking
A balanced ranking of cities across affordability, air quality, clean-energy readiness, and resilience.
40 cities from Netherlands appears in this ranking
Ranking
Cities that combine strong services, mobility, safety, clean air, and resilience into a healthy day-to-day profile.
40 cities from Netherlands appears in this ranking
Ranking
Cities that combine fast connectivity, safety, healthy day-to-day life, and a manageable cost-of-living balance for remote and hybrid workers.
40 cities from Netherlands appears in this ranking
Ranking
A health-oriented comparison of city air-quality scores using WHO-centered pollutant interpretation.
40 cities from Netherlands appears in this ranking
Ranking
Cities ranked by cost-of-living score, weighing housing pressure, essential spending, and household offsets across global metros.
40 cities from Netherlands appears in this ranking
Ranking
Cities ranked by internet speed, mobile coverage, and digital-readiness depth for residents, businesses, and remote workers.
40 cities from Netherlands appears in this ranking
Ranking
A ranking of city energy-transition readiness, grid resilience, clean-resource potential, and adaptation capacity.
40 cities from Netherlands appears in this ranking
Ranking
A practical affordability ranking that weighs housing pressure against transport access, services, and opportunity density.
40 cities from Netherlands appears in this ranking
See the full rankings directory for every available structured ranking.
Across 40 indexed cities, Amsterdam leads at 88/100 and Zwolle sits at 50/100. Use the country page as a parent context layer; module-level detail lives on each city profile. Data year 2025; last updated 2026-05-16. Drawn from 5 institutional references.
Structured indicators on this hub are directional and intended for orientation. Verified utility layers — emergency, healthcare, transport — are attributed to official publishers where available and use transparent fallback states where verified country-level data is not yet integrated.
Structured indicators on this page are directional and intended for orientation. Verified datasets are being integrated; official sources should be used for critical decisions.
5 institutional references inform this view, listed below with reliability notes. Structured indicators on this page are directional and intended for orientation; verified datasets are being integrated and official sources should be used for critical decisions.
Used as a policy and methodology reference for urban exposure and resilience signals.
Used as an energy-resource and weather-normalization reference.
Used where European city comparisons need monitored air-quality context.
Used to explain urban climate vulnerability and adaptation scoring logic.
Used to ground energy-readiness scoring in international transition guidance.