Supported cities
11
City profiles indexed for Switzerland.
Western Europe
Switzerland's profile reflects high-quality public services, low-carbon hydro and nuclear electricity, and a long tradition of careful urban and infrastructure planning. Switzerland is indexed at the country level in Western Europe, with 11 city profiles linked below.

Matterhorn
Image credit: Image: W. Bulach / Wikimedia Commons, CC BY-SA 4.0
Additional verified imagery for Switzerland. Each photo is sourced from Wikimedia Commons with full attribution and a permissive license.
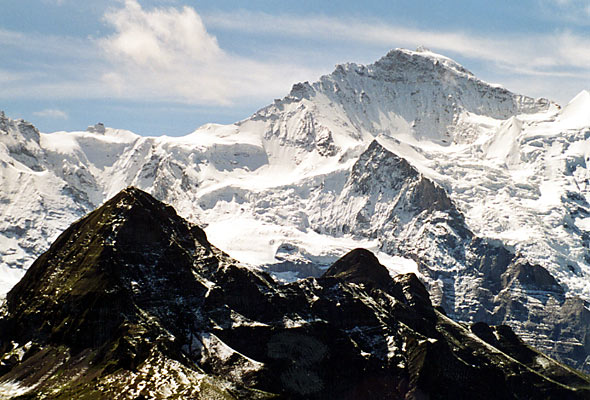
Jungfrau
Image credit: Image: Roland Zumbühl, Arlesheim / Wikimedia Commons, CC BY-SA 3.0
Snapshot of structured Switzerland city intelligence and which verified utility layers are available on this hub.
Supported cities
11
City profiles indexed for Switzerland.
Emergency profile
Verified
Country emergency contacts attributed to official publishers.
Healthcare profile
Fallback
Verified healthcare data is not available; fallback context is shown.
Transport profile
Fallback
Verified transport data is not available; fallback context is shown.
Related comparisons
1
Curated city-vs-city comparison pages that reference this country.
Related collections
3
Best Cities collections that include at least one city from this country.
Data year
2025
Reference year for the country intelligence dataset.
Last updated
2026-05-16
Most recent platform-side review of the country hub.
Very high
Health, transit, and education services support a stable daily life.
Low-carbon
Hydroelectric capacity provides a favorable starting point for transition.
High
Housing and services costs are the main resident well-being constraint.
Country pages group cities into crawlable clusters and give national context without replacing city-level comparisons.
| Metric | Value | Context |
|---|---|---|
| Region | Western Europe | Used for geographic clustering and regional comparisons. |
| Indexed cities | 11 | Lucerne, Lugano, St. Gallen, Lausanne, Bern, Winterthur, Zurich, Geneva, Basel, Biel/Bienne, Neuchâtel |
| Service quality | Very high | Health, transit, and education services support a stable daily life. |
| Energy mix | Low-carbon | Hydroelectric capacity provides a favorable starting point for transition. |
| Affordability pressure | High | Housing and services costs are the main resident well-being constraint. |
Each linked city page includes its own metadata, data table, source block, module links, and any verified utility layers.

Image credit: Image: W. Bulach / Wikimedia Commons, CC BY-SA 4.0
Switzerland / Western Europe
Use the Lucerne profile to compare tourism exposure, transport access, and cost-of-living framing alongside regional peers such as Zurich and Bern.

Image credit: Image: Aconcagua / Wikimedia Commons, CC BY-SA 3.0
Switzerland / Western Europe
Use the Lugano profile to compare cross-border commuting, transport access, and cost framing alongside regional peers such as Geneva and Zurich.

Image credit: Image: Thomas Woodtli from Zürich, Switzerland / Wikimedia Commons, CC BY-SA 2.0
Switzerland / Western Europe
Use the St. Gallen profile to compare institutional capacity, transport access, and cost framing alongside regional peers such as Zurich and Winterthur.

Image credit: Image: Rama / Wikimedia Commons, CC BY-SA 2.0 fr
Switzerland / Western Europe
Use the Lausanne profile to compare transport access, healthcare capacity, and cost-of-living framing alongside regional peers such as Geneva and Bern.

Image credit: Image: Thomas Woodtli from Zürich, Switzerland / Wikimedia Commons, CC BY-SA 2.0
Switzerland / Western Europe
Use the Bern profile to compare transport access, institutional capacity, and cost framing alongside regional peers such as Zurich and Basel.
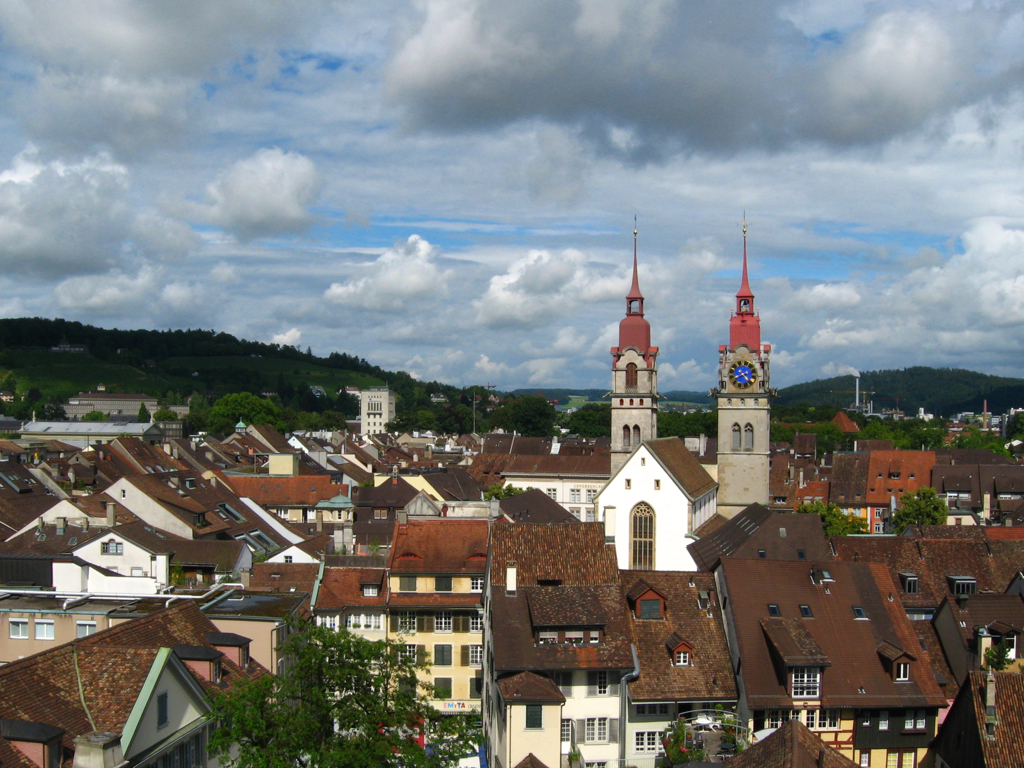
Image credit: Image: Simon Aughton / Wikimedia Commons, CC BY-SA 2.0
Switzerland / Western Europe
Use the Winterthur profile to compare transport access, industrial transition, and cost framing alongside regional peers such as Zurich and Basel.

Image credit: Image: Ikiwaner / Wikimedia Commons, CC BY-SA 3.0
Switzerland / Western Europe
Zurich is most informative for users comparing service quality, transit reliability, and clean-energy depth against high housing and services costs.

Image credit: Image: Yann / Wikimedia Commons, CC BY-SA 4.0
Switzerland / Western Europe
Use the Geneva profile to compare cost framing, mobility, and quality-of-life signals alongside Zurich and other Western-European metros.

Image credit: Image: Norbert Aepli, Switzerland (User:Noebu) / Wikimedia Commons, CC BY 2.5
Switzerland / Western Europe
Use the Basel profile to compare cost framing, mobility, and quality-of-life signals alongside Zurich and Geneva.

Image credit: Image: Nemo bis / Wikimedia Commons, CC BY-SA 3.0
Switzerland / Western Europe
Use the Biel/Bienne profile to compare affordability, livability, and economic indicators against other indexed cities in Switzerland and across Western Europe, and to explore nearby nature and weekend destinations.

Image credit: Image: Francoise Kuenzi / Wikimedia Commons, CC BY-SA 4.0
Switzerland / Western Europe
Use the Neuchâtel profile to compare affordability, livability, and economic indicators against other indexed cities in Switzerland and across Western Europe, and to explore nearby nature and weekend destinations.
Source-attributed country-level indicators for Switzerland, drawn from the World Bank Development Indicators. Use the cards and table together to compare scale, unit, and data year for each metric.
Country-level, not city-level
Indicators describe national context. Pair them with city profiles, comparisons, and verified utility layers (emergency, healthcare, transport) for local detail.
Source-attributed where available
Values come from the World Bank Development Indicators. Where no verified record exists, the platform shows a transparent fallback rather than a guessed number.
Different indicators, different years
Each record carries its own data year because publishers refresh indicators on their own cadence. The card and table both display the year alongside the value.
Context, not a ranking
Treat indicators as orientation, not as a leaderboard. The platform never claims any country is best, safest, cleanest, richest, healthiest, or most connected.
Read alongside city intelligence
Country indicators are most useful when combined with the city profiles in the country, the public-safety, healthcare, and transport sections, and the methodology and data-sources pages.
For full construction details, read the methodology page and the data sources registry.
National-level economic signals to read alongside city-level cost and services pages.
GDP per capita
VerifiedEconomic context only — not a cost-of-living score or a household-income measure.
Data year 2024 updated 2026-04-08
Unemployment rate
VerifiedModeled ILO labor-market context — not a guarantee of job availability for any specific worker.
Data year 2025 updated 2026-04-08
National scale and urbanisation context; pair with city profiles for local detail.
Population
VerifiedNational scale only — not a city population value or a measure of urban density.
Data year 2024 updated 2026-04-08
Urban population share
VerifiedShare of population living in urban areas — not a quality-of-life or urban-form measure.
Data year 2024 updated 2026-04-08
Connectivity context drawn from World Bank usage and subscription indicators.
Internet usage
VerifiedShare of population that uses the internet — not a measure of connection speed or quality.
Data year 2025 updated 2026-04-08
Fixed broadband subscriptions
VerifiedFixed broadband subscriptions per 100 people — not a measure of overall internet quality or speed.
Data year 2024 updated 2026-04-08
National health-system context; not a substitute for verified city-level healthcare layers.
Life expectancy
VerifiedNational health-context indicator — not individual health guidance.
Data year 2024 updated 2026-04-08
Health expenditure per capita
VerifiedPer-capita spending context — not a measure of healthcare quality or access for any individual.
Data year 2023 updated 2026-04-08
National emissions context; read separately from city-level air-quality data.
CO₂ emissions per capita
VerifiedNational emissions context — not a city-level air-quality measurement.
Data year 2024 updated 2026-04-08
| Indicator | Value | Unit | Data year | Status |
|---|---|---|---|---|
| Population | 9,005,582 | people | 2024 | Verified |
| Internet usage | 97.32 | percent | 2025 | Verified |
| Urban population share | 85.46 | percent | 2024 | Verified |
| GDP per capita | 103,998.19 | current US$ | 2024 | Verified |
| Life expectancy | 84.41 | years | 2024 | Verified |
| Health expenditure per capita | 11,783.67 | current US$ | 2023 | Verified |
| Unemployment rate | 4.87 | percent | 2025 | Verified |
| CO₂ emissions per capita | 3.75 | metric tons per capita | 2024 | Verified |
| Fixed broadband subscriptions | 47.02 | per 100 people | 2024 | Verified |
Global City Intelligence — country indicators dataset
VerifiedCountry indicator values appear in this section only after they are sourced from accepted publishers and validated at build time. Malformed records cannot ship to production.
Verified emergency contacts for Switzerland, drawn from official emergency services and government publishers. Use these as a starting point and confirm current details with local authorities before traveling or relocating.
| Service | Number | Notes |
|---|---|---|
| European emergency | 11224/7 | 112 routes to police, fire, or ambulance dispatch nationwide. |
| Police | 11724/7 | — |
| Ambulance | 14424/7 | — |
| Fire | 11824/7 | — |
Each emergency contact above is attributed to an official emergency service or government publisher. Confirm current numbers directly with these sources.
Used as the primary attribution for the EU-wide 112 universal emergency number on European country profiles.
Last verified: 2026-05-16
Methodology and the wider source registry are documented on the scoring methodology and data sources pages.
Verified national healthcare information for Switzerland, drawn from official government and public health publishers. This is informational only and does not provide medical advice.
Related sections: emergency and public safety, scoring methodology, and data sources.
Verified national transport context for Switzerland, attributed to official transport ministries, national operators, and aviation authorities. This is informational only; routes, fares, and schedules change frequently — check the linked authorities for current details.
Related sections: emergency and public safety, healthcare and hospitals, cities directory, countries directory, scoring methodology, data sources.
Curated city-vs-city comparisons that include at least one city from Switzerland. Each link opens a comparison page with structured indicators across cost, safety, healthcare, transport, and country context.
Curated city collections that include at least one Switzerland city. Each collection is a comparison-oriented shortlist, not an official ranking.
Family life
A comparison-oriented collection of cities seen through family-relevant context: safety, healthcare, public services, transport, air quality, and livability indicators. Designed for comparison, not as an official family ranking.
1 city from Switzerland in this collection
Clean air
An air quality-oriented city collection. Designed for comparison through WHO and regional air-quality context — not a ranked claim of which city has the cleanest air.
1 city from Switzerland in this collection
Public transport
A mobility-focused city collection comparing cities with useful public-transport context and verified transport or mobility profiles where available.
1 city from Switzerland in this collection
Explore rankings where supported Switzerland city profiles appear. Use rankings as directional city intelligence, not an official government ranking.
Ranking
A balanced ranking of cities across affordability, air quality, clean-energy readiness, and resilience.
11 cities from Switzerland appears in this ranking
Ranking
Cities that combine strong services, mobility, safety, clean air, and resilience into a healthy day-to-day profile.
11 cities from Switzerland appears in this ranking
Ranking
Cities that combine fast connectivity, safety, healthy day-to-day life, and a manageable cost-of-living balance for remote and hybrid workers.
11 cities from Switzerland appears in this ranking
Ranking
A health-oriented comparison of city air-quality scores using WHO-centered pollutant interpretation.
11 cities from Switzerland appears in this ranking
Ranking
Cities ranked by cost-of-living score, weighing housing pressure, essential spending, and household offsets across global metros.
11 cities from Switzerland appears in this ranking
Ranking
Cities ranked by internet speed, mobile coverage, and digital-readiness depth for residents, businesses, and remote workers.
11 cities from Switzerland appears in this ranking
Ranking
A ranking of city energy-transition readiness, grid resilience, clean-resource potential, and adaptation capacity.
11 cities from Switzerland appears in this ranking
Ranking
A practical affordability ranking that weighs housing pressure against transport access, services, and opportunity density.
11 cities from Switzerland appears in this ranking
See the full rankings directory for every available structured ranking.
Across 11 indexed cities, Zurich leads at 90/100 and St. Gallen sits at 70/100. Use the country page as a parent context layer; module-level detail lives on each city profile. Data year 2025; last updated 2026-05-16. Drawn from 5 institutional references.
Structured indicators on this hub are directional and intended for orientation. Verified utility layers — emergency, healthcare, transport — are attributed to official publishers where available and use transparent fallback states where verified country-level data is not yet integrated.
Structured indicators on this page are directional and intended for orientation. Verified datasets are being integrated; official sources should be used for critical decisions.
5 institutional references inform this view, listed below with reliability notes. Structured indicators on this page are directional and intended for orientation; verified datasets are being integrated and official sources should be used for critical decisions.
Used as a policy and methodology reference for urban exposure and resilience signals.
Used as an energy-resource and weather-normalization reference.
Used where European city comparisons need monitored air-quality context.
Used to explain urban climate vulnerability and adaptation scoring logic.
Used to ground energy-readiness scoring in international transition guidance.