Overall score
Cape Town is most useful for users comparing outdoor amenity, cultural depth, and resilience progress against energy-supply variability and water-cycle pressure.
Overall74/100
Affordability76/100
Air quality78/100
Energy70/100
South Africa / Africa
Cape Town is a coastal South African city known for striking natural surroundings, a deep tourism and creative-industry presence, and active work on energy and water resilience. Cape Town is a africa city of about 4.8M metro in South Africa. On the composite city-intelligence score, Cape Town sits around the indexed median (74/100).

Image credit: Image: Diego Delso / Wikimedia Commons, CC BY-SA 4.0
Additional verified imagery for Cape Town, South Africa. Each photo is sourced from Wikimedia Commons with full attribution and a permissive license.
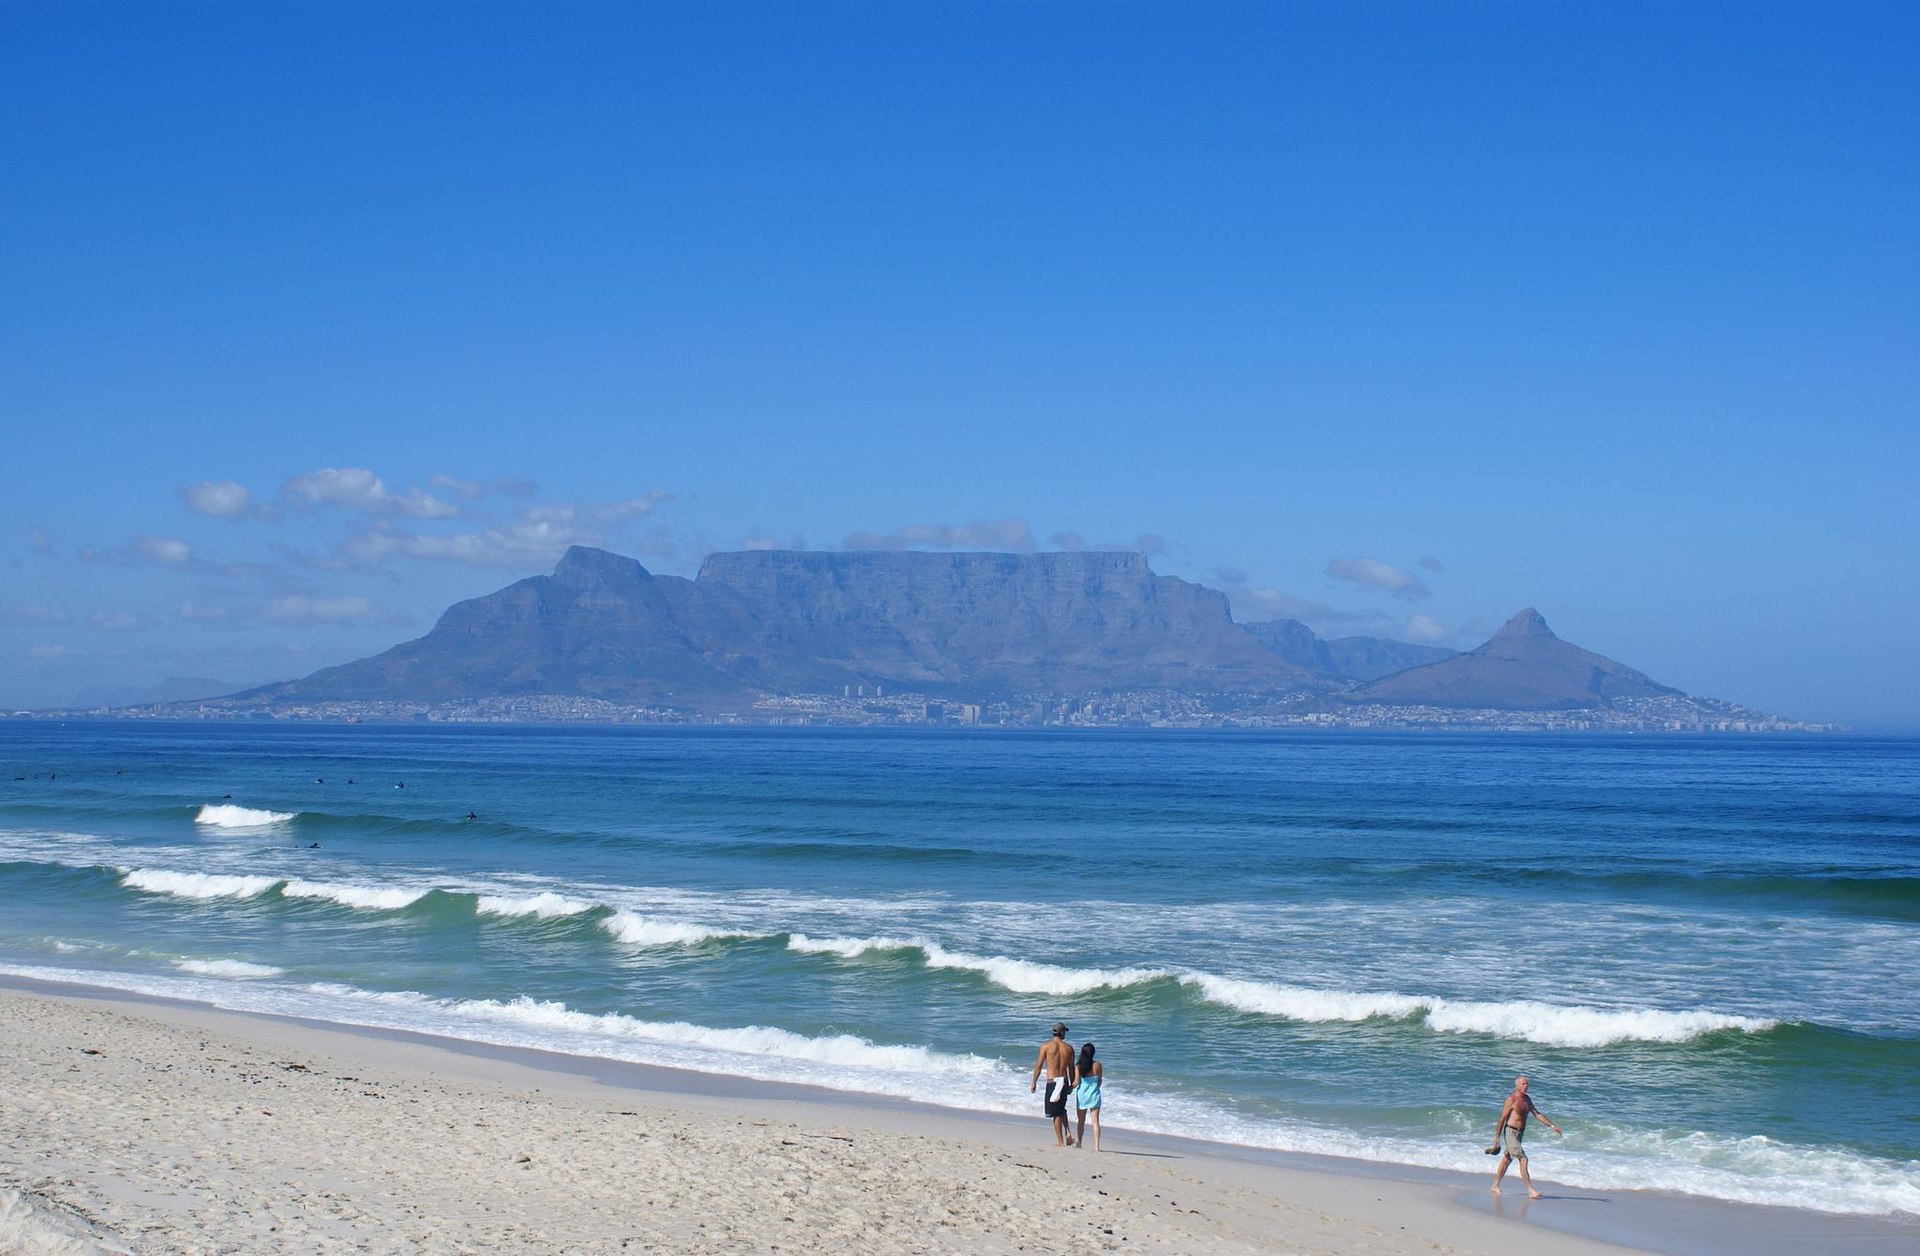
Table Mountain
Image credit: Image: Danie van der Merwe from Cape Town, South Africa / Wikimedia Commons, CC BY 2.0
Cape Town is most useful for users comparing outdoor amenity, cultural depth, and resilience progress against energy-supply variability and water-cycle pressure.
74/100
Strong outdoor amenity and cultural depth with energy and water-cycle pressure to manage.
Very high
Coastal and mountain access supports a strong quality of daily life.
Active
Drought-cycle planning is integrated into urban operations.
The table is part of the initial server-rendered HTML and mirrors the key city score cards.
| Metric | Value | Context |
|---|---|---|
| Overall score | 74/100 | Composite score across major city intelligence modules. |
| Cost of Living | 76/100 | Cape Town offers comparatively favorable affordability for a major coastal city, with rising rent pressure in central neighborhoods. |
| Air Quality | 78/100 | Cape Town has solid baseline air quality, with episodic regional and biomass-burning events as the main exposure spikes. |
| Energy | 70/100 | Cape Town has solid renewable potential and active local transition work, balanced by national grid-supply variability. |
| Safety | 64/100 | Cape Town has mid-tier safety with strong neighborhood variation; resident experience differs widely across districts and time of day. |
| Internet Speed | 76/100 | Cape Town has solid fiber broadband and reliable mobile coverage, supporting a growing remote-work and tourism-services presence. |
| Climate Risk | 66/100 | Cape Town faces meaningful climate exposure from drought, heat, and wildfire pressure, balanced by active adaptation programs. |
| Resilience | 72/100 | Climate adaptation and infrastructure continuity context. |
Deterministic safety estimates from our index — planning signals derived from country priors and city data, not official crime statistics.
Cape Town scores below average for safety in our index (46/100); research neighborhoods and take standard precautions.
A composite quality-of-life estimate and its component indicators.
Cape Town has a moderate quality-of-life estimate (59/100) across our combined indicators.
How the city scores for raising a family, with the indicators that drive it.
Cape Town scores moderate for family living (56/100).
Suitability for remote workers, based on connectivity, mobility, and livability.
Cape Town is moderate for remote workers (67/100), based on connectivity, affordability and walkability and day-to-day amenities.
Suitability for retirement, weighing healthcare, affordability, climate, and environment.
Cape Town is moderate for retirement (61/100), appealing for affordability and a comfortable climate.
Local public safety guidance for Cape Town, with the country-level emergency contacts that apply when calling for police, fire, or ambulance.
For the universal emergency contacts that apply in Cape Town, including police, fire, and ambulance, see the South Africa emergency profile, which currently lists no verified national contacts.
Methodology and the wider source registry are documented on the scoring methodology and data sources pages.
Healthcare context for Cape Town, with national-level information from South Africa where city-specific data is not yet verified. This is informational only and does not provide medical advice.
For the national healthcare and public-health context that applies in Cape Town, see the South Africa healthcare profile, which currently lists no verified national healthcare information.
Related sections: emergency and public safety, scoring methodology, and data sources.
Local mobility context for Cape Town, with national-level context from South Africa where city-specific data is not yet verified. This is informational only.
For national transport authorities and operators that apply in Cape Town, see the South Africa transport profile, which currently lists no verified national transport information.
Related sections: emergency and public safety, healthcare and hospitals, cities directory, countries directory, scoring methodology, data sources.
Source-attributed air-quality dataset for Cape Town. Verified measurements are surfaced when published from accepted official datasets; transparent fallback is shown otherwise.
Source-attributed values for Cape Town will appear here after the platform integrates verified measurements from accepted official publishers. Until then, structured air-quality module context remains available on the dedicated module page.
| Metric | Value | Data year | Status |
|---|---|---|---|
| Air quality | Verified air-quality measurements are not yet published for this location. | ||
Global City Intelligence — air-quality dataset
Verified data unavailableThe air-quality dataset begins empty by design. Verified city-level measurements appear here only after they are sourced from accepted publishers (WHO, EEA, US EPA, OpenAQ, OECD, or official national/city environmental agencies).
Numeric measurements appear in this section only after they are sourced from accepted official publishers. The dataset is independently validated at build time; malformed records cannot ship to production.
Pairs that share a city, comparison intent, or region — useful for users planning a wider relocation, remote-work, or business decision.
City pages link to module and ranking pages so crawlers can move through the topic cluster naturally.
Cape Town offers comparatively favorable affordability for a major coastal city, with rising rent pressure in central neighborhoods.
Cape Town has solid baseline air quality, with episodic regional and biomass-burning events as the main exposure spikes.
Cape Town has solid renewable potential and active local transition work, balanced by national grid-supply variability.
Cape Town has mid-tier safety with strong neighborhood variation; resident experience differs widely across districts and time of day.
Cape Town has solid fiber broadband and reliable mobile coverage, supporting a growing remote-work and tourism-services presence.
Cape Town faces meaningful climate exposure from drought, heat, and wildfire pressure, balanced by active adaptation programs.
Compare this city against other indexed cities in crawlable ranking tables.
Cost of living estimates for Cape Town — monthly budgets, rent, food, and transport in the local currency, plus an affordability score for comparison. Planning estimates derived from country baselines, not live prices.
Climate profile for Cape Town — Semi-Arid climate, annual average 20.8°C, comfort score 79/100. Month-by-month temperatures, rainfall, sunshine, and the best months to visit. Deterministic planning estimates, not a forecast.
Economy and jobs profile for Cape Town — tourism economy, economy score 58/100, key industries including manufacturing, tourism, mining. Employment, salary, startup, remote-work, and career indicators. Deterministic planning estimates.
Education profile for Cape Town — regional education center, education score 62/100, 6 representative universities, plus research, student life, and international-student indicators. Deterministic dataset, not institutional rankings.
Healthcare and retirement profile for Cape Town — mixed healthcare profile, healthcare score 57/100, retirement score 63/100. Medical access, specialist and emergency care, affordability, and retirement suitability. Deterministic planning estimates.
Estimate a monthly budget for Cape Town using your own housing, food, transport, healthcare, and lifestyle inputs. Planning estimator only — not an official cost-of-living measurement.
Plan a trip budget for Cape Town using your own accommodation, food, local transport, activities, travel, healthcare buffer, and emergency buffer inputs. Planning estimator only — not an official travel cost estimate.
Where else nearby you could spend a day or a weekend from Cape Town. Links are derived from geographic proximity, shared region, shared natural-recreation areas, transport corridors, and country borders — not popularity or tourism rankings.
Same region · about 41 km from Cape Town. Explore Stellenbosch's city intelligence profile.
Cross-border · about 1263 km from Cape Town. Explore Gaborone's city intelligence profile.
Same region · about 1265 km from Cape Town. Explore Johannesburg's city intelligence profile.
Cross-border · about 1273 km from Cape Town. Explore Windhoek's city intelligence profile.
Weekend trip · about 1274 km from Cape Town. Explore Durban's city intelligence profile.
Cape Town is most useful for users comparing outdoor amenity, cultural depth, and resilience progress against energy-supply variability and water-cycle pressure. Its standout dimensions are air quality (78/100) and cost of living (76/100). The area most worth watching is safety (64/100), where the model registers practical gaps. Data year 2025; last updated 2026-05-16. Drawn from 4 institutional references.
Country context is available on the South Africa country page. Related rankings include Overall Intelligence, Quality of Life, Remote Work. See where Cape Town appears in global rankings or read the scoring methodology.
Structured indicators on this page are directional and intended for orientation. Verified datasets are being integrated; official sources should be used for critical decisions.
4 institutional references inform this view, listed below with reliability notes. Structured indicators on this page are directional and intended for orientation; verified datasets are being integrated and official sources should be used for critical decisions.
Used as a policy and methodology reference for urban exposure and resilience signals.
Used to normalize air-quality indicators toward health-protective benchmarks.
Used as an energy-resource and weather-normalization reference.
Used to explain urban climate vulnerability and adaptation scoring logic.