Supported cities
55
City profiles indexed for United Kingdom.
Western Europe
The United Kingdom's profile combines strong financial and creative industries with mature climate policy, transit reach, and rising housing pressure in major cities. United Kingdom is indexed at the country level in Western Europe, with 55 city profiles linked below.
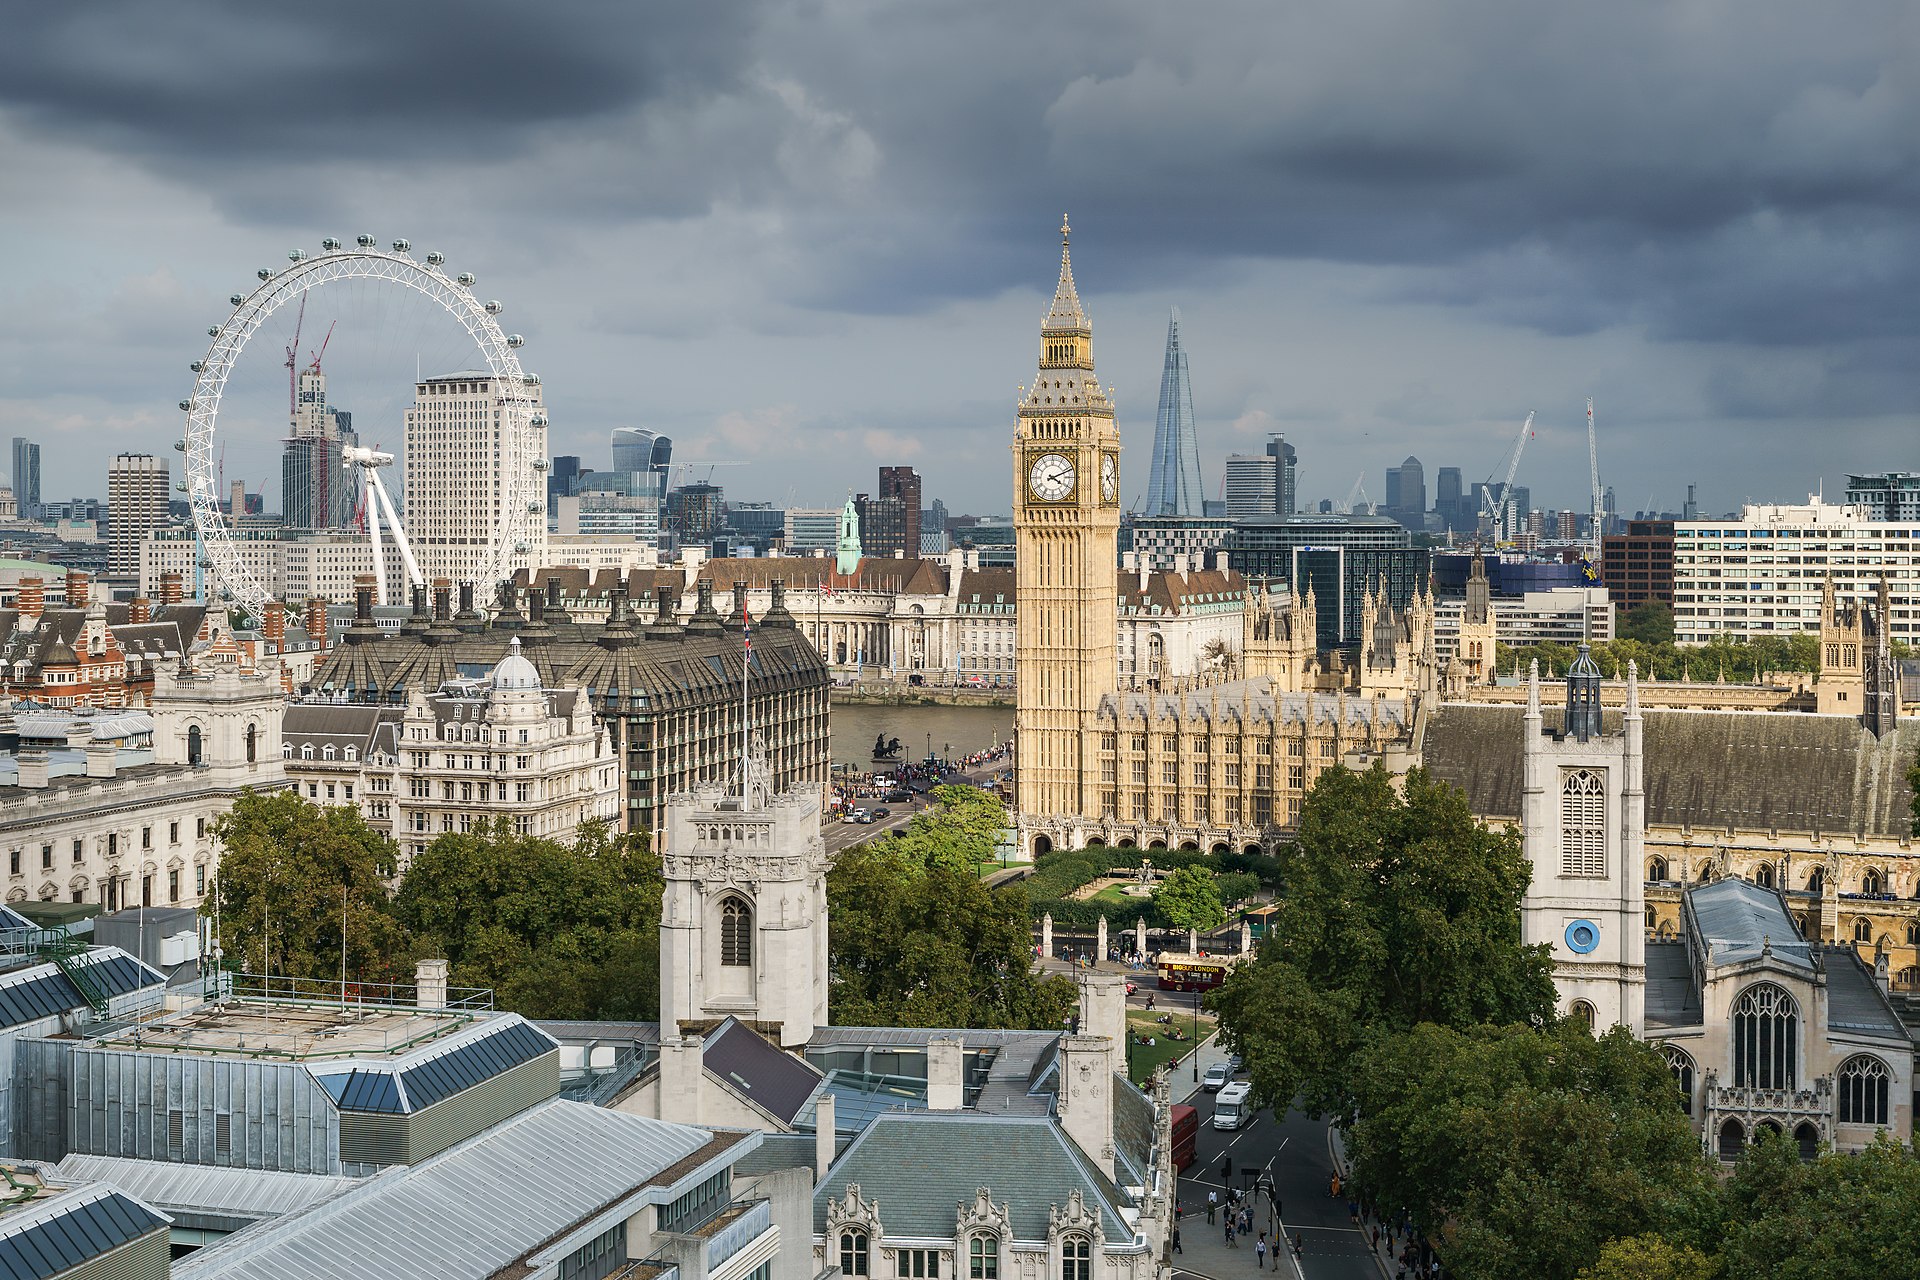
Image credit: Image: Colin / Wikimedia Commons, CC BY-SA 4.0
Additional verified imagery for United Kingdom. Each photo is sourced from Wikimedia Commons with full attribution and a permissive license.

Stonehenge
Image credit: Image: Stefan Kühn / Wikimedia Commons, CC BY-SA 3.0
Snapshot of structured United Kingdom city intelligence and which verified utility layers are available on this hub.
Supported cities
55
City profiles indexed for United Kingdom.
Emergency profile
Verified
Country emergency contacts attributed to official publishers.
Healthcare profile
Verified
Healthcare layer attributed to official health authorities.
Transport profile
Verified
Transport authority and operator references attributed to official sources.
Related comparisons
11
Curated city-vs-city comparison pages that reference this country.
Related collections
2
Best Cities collections that include at least one city from this country.
Data year
2025
Reference year for the country intelligence dataset.
Last updated
2026-05-16
Most recent platform-side review of the country hub.
Strong
Clean-air zones and net-zero targets shape major-city implementation.
High transparency
Public monitoring supports pollutant comparison and health framing.
High
Housing pressure is the main resident well-being constraint in major cities.
Country pages group cities into crawlable clusters and give national context without replacing city-level comparisons.
| Metric | Value | Context |
|---|---|---|
| Region | Western Europe | Used for geographic clustering and regional comparisons. |
| Indexed cities | 55 | Chester, Newport, Stirling, Wrexham, Gloucester, Swindon, Bournemouth, Middlesbrough, Reading, Preston, Southend-on-Sea, Milton Keynes, Northampton, Luton, Leicester, Coventry, Bradford, Portsmouth, Wolverhampton, Sunderland, Derby, London, Edinburgh, Manchester, Birmingham, Bristol, Leeds, Glasgow, Belfast, Cardiff, Oxford, Cambridge, Liverpool, Sheffield, Brighton, York, Southampton, Aberdeen, Dundee, Bath, Newcastle upon Tyne, Nottingham, Exeter, Plymouth, Norwich, Swansea, Inverness, Derry, Durham, Lancaster, Carlisle, Lincoln, Kingston upon Hull, Stoke-on-Trent, Truro |
| Urban policy context | Strong | Clean-air zones and net-zero targets shape major-city implementation. |
| Air-quality context | High transparency | Public monitoring supports pollutant comparison and health framing. |
| Affordability pressure | High | Housing pressure is the main resident well-being constraint in major cities. |
Each linked city page includes its own metadata, data table, source block, module links, and any verified utility layers.

Image credit: Image: Crashlanded / Wikimedia Commons, CC BY-SA 3.0
United Kingdom / Western Europe
Use the Chester profile to compare affordability, air quality, energy planning, and climate resilience alongside Liverpool, Manchester, and Cardiff.

Image credit: Image: WFan / Wikimedia Commons, CC BY-SA 4.0
United Kingdom / Western Europe
Use the Newport profile to compare affordability, air quality, energy planning, and climate resilience alongside Cardiff, Bristol, and Birmingham.

Image credit: Image: Stirling Council from Stirling, UK / Wikimedia Commons, CC BY 2.0
United Kingdom / Western Europe
Use the Stirling profile to compare affordability, air quality, energy planning, and climate resilience alongside Edinburgh, Glasgow, and York.

Image credit: Image: Geof Sheppard / Wikimedia Commons, CC BY-SA 4.0
United Kingdom / Western Europe
Use the Wrexham profile to compare affordability, air quality, energy planning, and climate resilience alongside Liverpool, Manchester, and Cardiff.

Image credit: Image: Bob Embleton / Wikimedia Commons, CC BY-SA 2.0
United Kingdom / Western Europe
Use the Gloucester profile to compare affordability, air quality, energy planning, and climate resilience alongside Bristol, Cardiff, and Bath.

Image credit: Image: Loco Steve / Wikimedia Commons, CC BY-SA 2.0
United Kingdom / Western Europe
Use the Swindon profile to compare affordability, air quality, energy planning, and climate resilience alongside Bristol, Oxford, and Bath.

Image credit: Image: Chris Downer / Wikimedia Commons, CC BY-SA 2.0
United Kingdom / Western Europe
Use the Bournemouth profile to compare cost framing, transport access, and coastal climate-adaptation context alongside regional peers such as Southampton, Portsmouth, and Brighton.

Image credit: Image: Originally uploaded by MarcusBritish (Transferred by Hogweard) / Wikimedia Commons, CC BY-SA 3.0
United Kingdom / Western Europe
Use the Middlesbrough profile to compare cost framing, transport access, and industrial-transition context alongside regional peers such as Newcastle upon Tyne, Sunderland, and Durham.

Image credit: Image: Paul Gillett / Wikimedia Commons, CC BY-SA 2.0
United Kingdom / Western Europe
Use the Reading profile to compare cost framing, transport access, and labour-market context alongside regional peers such as Oxford, London, and Southampton.

Image credit: Image: Steve Daniels / Wikimedia Commons, CC BY-SA 2.0
United Kingdom / Western Europe
Use the Preston profile to compare cost framing, transport access, and labour-market context alongside regional peers such as Manchester, Liverpool, and Lancaster.

Image credit: Image: Terryjoyce / Wikimedia Commons, CC BY-SA 3.0
United Kingdom / Western Europe
Use the Southend-on-Sea profile to compare cost framing, transport access, and coastal climate-adaptation context alongside regional peers such as London, Brighton, and Norwich.

Image credit: Image: fabiolah / Wikimedia Commons, CC BY 3.0
United Kingdom / Western Europe
Use the Milton Keynes profile to compare cost framing, transport access, and labour-market context alongside regional peers such as London, Birmingham, and Coventry.

Image credit: Image: Andrew Abbott / Wikimedia Commons, CC BY-SA 2.0
United Kingdom / Western Europe
Use the Northampton profile to compare cost framing, transport access, and labour-market context alongside regional peers such as Leicester, Coventry, and Milton Keynes.

Image credit: Image: Thomas Nugent / Wikimedia Commons, CC BY-SA 2.0
United Kingdom / Western Europe
Use the Luton profile to compare cost framing, transport access, and labour-market context alongside regional peers such as London, Milton Keynes, and Cambridge.

Image credit: Image: Daveleicuk / Wikimedia Commons, CC BY-SA 4.0
United Kingdom / Western Europe
Use the Leicester profile to compare affordability, transport access, and air-quality context alongside regional peers such as Nottingham, Birmingham, and Sheffield.

Image credit: Image: E Gammie / Wikimedia Commons, CC BY-SA 2.0
United Kingdom / Western Europe
Use the Coventry profile to compare affordability, energy context, and transport access alongside regional peers such as Birmingham, Nottingham, and Leeds.

Image credit: Image: Jon Farman / Wikimedia Commons, Public domain
United Kingdom / Western Europe
Use the Bradford profile to compare affordability, transport access, and air-quality context alongside regional peers such as Leeds, Sheffield, and Manchester.

Image credit: Image: en:User:AlanFord / Wikimedia Commons, Public domain
United Kingdom / Western Europe
Use the Portsmouth profile to compare affordability, climate-adaptation context, and transport access alongside regional peers such as Brighton, Southampton, and Plymouth.

Image credit: Image: Statsfan / Wikimedia Commons, CC BY-SA 3.0
United Kingdom / Western Europe
Use the Wolverhampton profile to compare affordability, energy context, and transport access alongside regional peers such as Birmingham, Stoke-on-Trent, and Nottingham.

Image credit: Image: Mackem16_CVB / Wikimedia Commons, CC BY-SA 3.0
United Kingdom / Western Europe
Use the Sunderland profile to compare affordability, energy context, and transport access alongside regional peers such as Newcastle, Leeds, and Sheffield.

Image credit: Image: Henry Lark Pratt / Wikimedia Commons, Public domain
United Kingdom / Western Europe
Use the Derby profile to compare affordability, energy context, and transport access alongside regional peers such as Nottingham, Birmingham, and Sheffield.

Image credit: Image: Ilya Grigorik / Wikimedia Commons, CC BY-SA 3.0
United Kingdom / Western Europe
London is most informative for users comparing opportunity, transit reach, and clean-air policy momentum against high housing costs.

Image credit: Image: 瑞丽江的河水 / Wikimedia Commons, CC BY-SA 4.0
United Kingdom / Western Europe
Read Edinburgh as a high-amenity, services-led capital where heritage and quality of life balance housing pressure.

Image credit: Image: Daniel Nisbet from Manchester, United Kingdom / Wikimedia Commons, CC BY 2.0
United Kingdom / Western Europe
Use the Manchester profile to compare structured indicators across cost, transport, healthcare context, and country-level signals alongside other major UK cities.

Image credit: Image: JimmyGuano / Wikimedia Commons, CC BY-SA 4.0
United Kingdom / Western Europe
Use the Birmingham profile to compare cost framing, transport access, and country-level context against London, Manchester, and other UK cities.
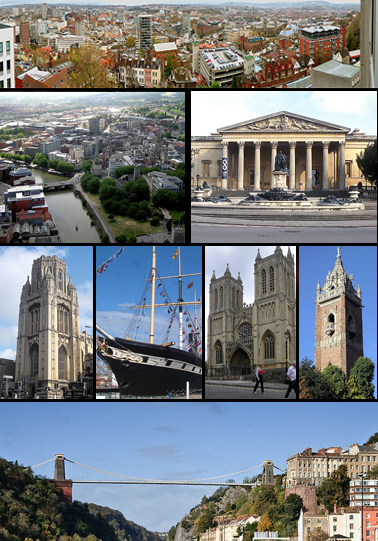
Image credit: Image: Bleff / Wikimedia Commons, CC BY-SA 3.0
United Kingdom / Western Europe
Use the Bristol profile to compare cost framing, transport access, and country-level intelligence alongside other mid-size UK cities.

Image credit: Image: Andrew roberts uk / Wikimedia Commons, CC BY-SA 3.0
United Kingdom / Western Europe
Use the Leeds profile to compare cost framing, transport access, and country-level context across the UK's Northern metro cluster.

Image credit: Image: 瑞丽江的河水 / Wikimedia Commons, CC BY-SA 4.0
United Kingdom / Western Europe
Use the Glasgow profile to compare cost framing, transport access, and country-level context alongside Edinburgh and other Scottish-region cities.
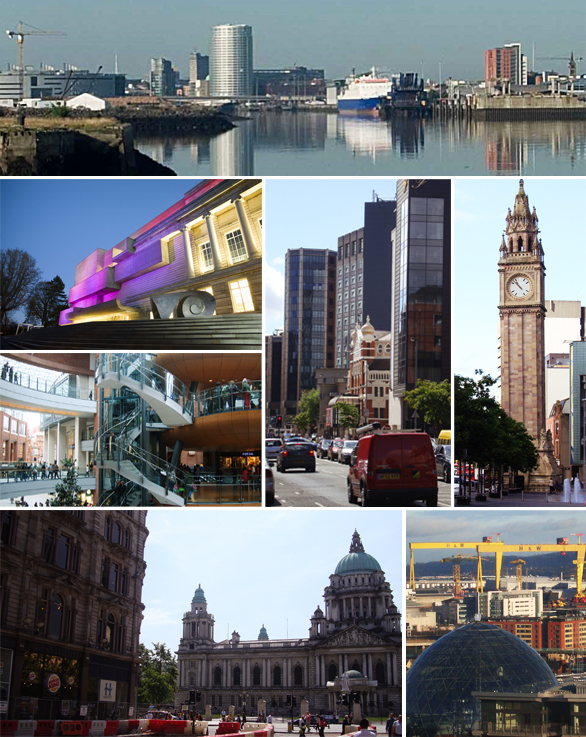
Image credit: Image: Conor2k10 / Wikimedia Commons, Public domain
United Kingdom / Western Europe
Use the Belfast profile to compare cost framing, transport access, and country-level context against other UK and Irish metros.

Image credit: Image: MichiganCharms / Wikimedia Commons, CC BY-SA 3.0
United Kingdom / Western Europe
Use the Cardiff profile to compare cost framing, transport access, and country-level context alongside Bristol and other UK mid-size cities.

Image credit: Image: Andrew Gray / Wikimedia Commons, CC BY-SA 3.0
United Kingdom / Western Europe
Use the Oxford profile to compare cost framing, transport access, healthcare context, and country-level intelligence alongside other English regional cores.

Image credit: Image: Andrew Dunn / Wikimedia Commons, CC BY-SA 2.0
United Kingdom / Western Europe
Use the Cambridge profile to compare cost framing, transport access, and country-level context alongside Oxford and other English research cores.

Image credit: Image: Fatih Renkligil / Wikimedia Commons, CC BY-SA 4.0
United Kingdom / Western Europe
Use the Liverpool profile to compare cost framing, transport access, and country-level context alongside Manchester and Leeds.

Image credit: Image: Neil Theasby / Wikimedia Commons, CC BY 2.5
United Kingdom / Western Europe
Use the Sheffield profile to compare cost framing, transport access, and country-level context alongside Leeds and Manchester.

Image credit: Image: Bojan Lazarevic, ZivojinMisic slike / Wikimedia Commons, CC BY 3.0
United Kingdom / Western Europe
Use the Brighton profile to compare cost framing, transport access, and country-level context alongside other southern English metros.

Image credit: Image: DACP / Wikimedia Commons, CC BY-SA 2.0
United Kingdom / North Yorkshire
Use this record as a regional planning anchor while deeper source integration is pending. Verify access, transport, and seasonal context with official sources before relying on the page for travel decisions.

Image credit: Image: John Lucas / Wikimedia Commons, CC BY-SA 2.0
United Kingdom / Hampshire
Use this record as a regional planning anchor while deeper source integration is pending. Verify access, transport, and seasonal context with official sources before relying on the page for travel decisions.

Image credit: Image: Ragazzi00 / Wikimedia Commons, CC BY-SA 3.0
United Kingdom / Aberdeenshire
Use this record as a regional planning anchor while deeper source integration is pending. Verify access, transport, and seasonal context with official sources before relying on the page for travel decisions.

Image credit: Image: Laerol / Wikimedia Commons, CC0
United Kingdom / Northern Europe
Use this record as a regional planning anchor while deeper source integration is pending. Verify access, transport, and seasonal context with official sources before relying on the page for travel decisions.

Image credit: Image: Raboe001 / Wikimedia Commons, CC BY-SA 3.0
United Kingdom / Somerset
Use this record as a planning anchor for local-first research and nearby weekend-rest discovery, verifying access, transport, and seasonal context with official sources.
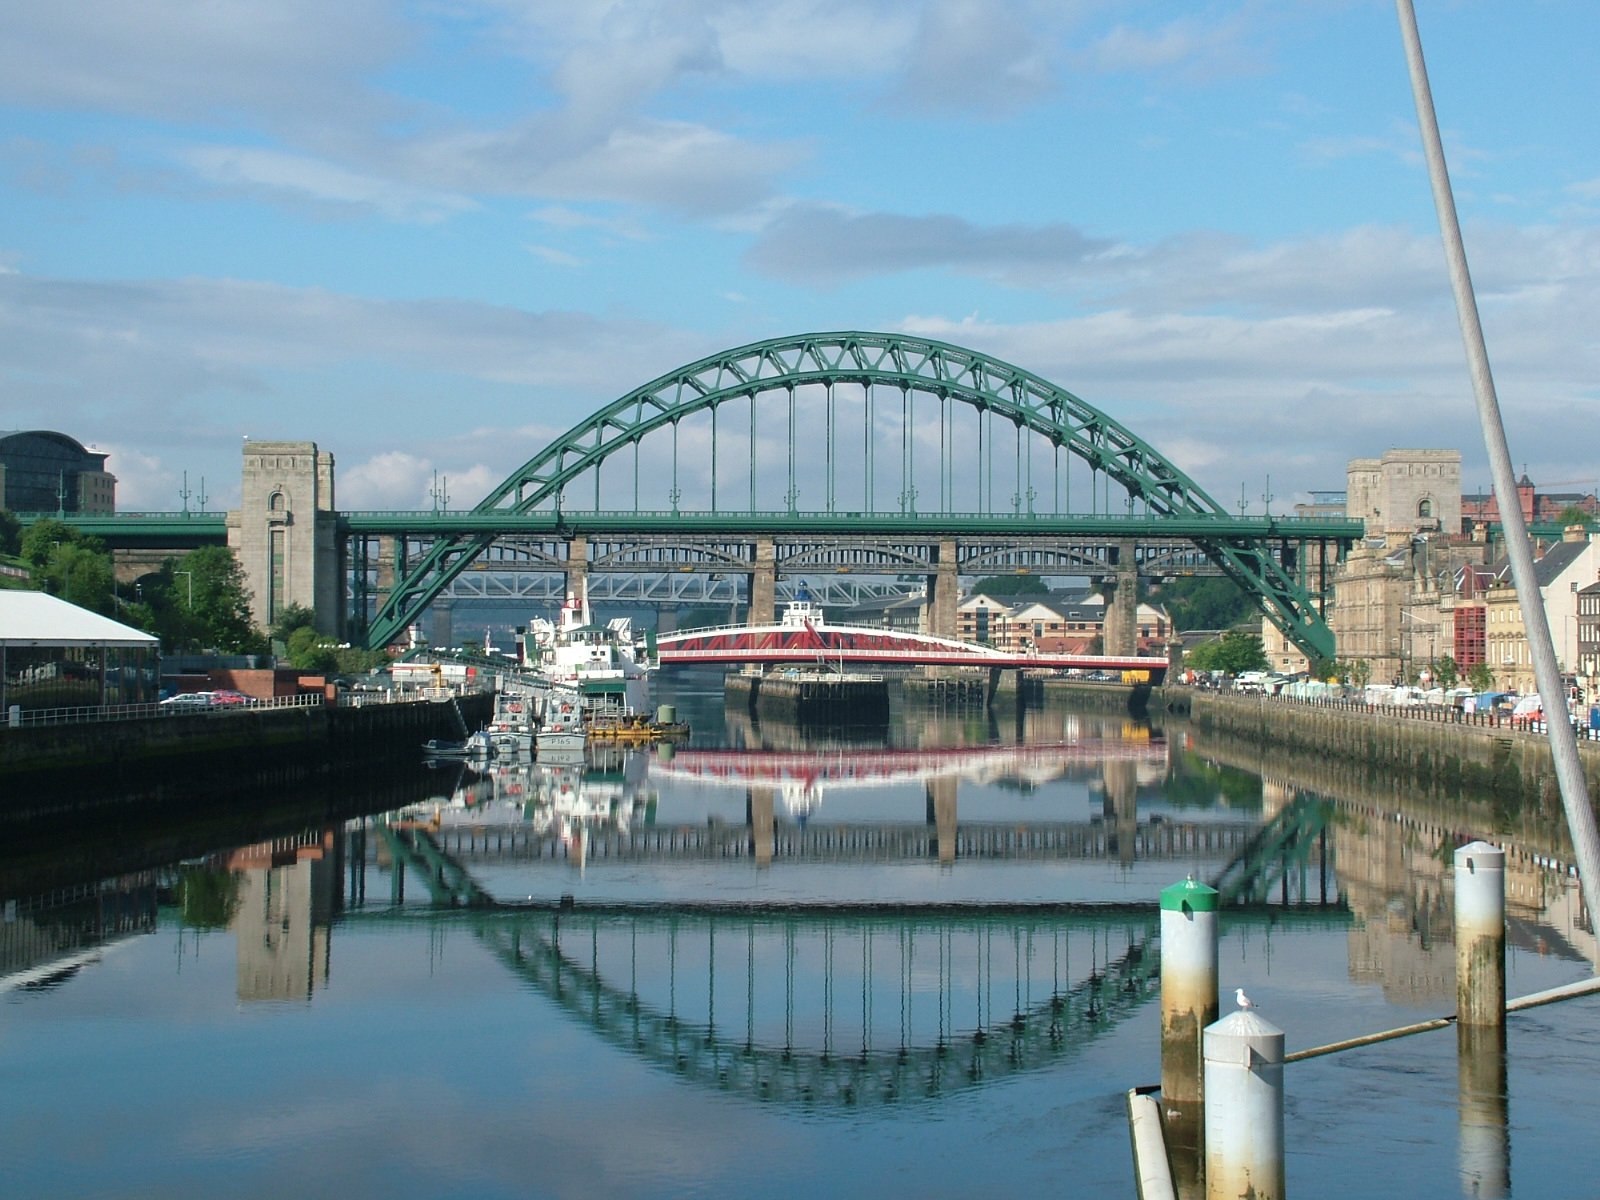
Image credit: Image: Tagishsimon / Wikimedia Commons, CC BY-SA 3.0
United Kingdom / Tyne and Wear
Use this record as a planning anchor for local-first research and nearby weekend-rest discovery, verifying access, transport, and seasonal context with official sources.

Image credit: Image: Willednic at English Wikipedia / Wikimedia Commons, CC BY 3.0
United Kingdom / Nottinghamshire
Use this record as a planning anchor for local-first research and nearby weekend-rest discovery, verifying access, transport, and seasonal context with official sources.

Image credit: Image: Nilfanion / Wikimedia Commons, CC BY-SA 3.0
United Kingdom / Devon
Use this record as a planning anchor for local-first research and nearby weekend-rest discovery, verifying access, transport, and seasonal context with official sources.

Image credit: Image: Derek Harper / Wikimedia Commons, CC BY-SA 2.0
United Kingdom / Devon
Use this record as a planning anchor for local-first research and nearby weekend-rest discovery, verifying access, transport, and seasonal context with official sources.

Image credit: Image: Ashley Dace / Wikimedia Commons, CC BY-SA 2.0
United Kingdom / Norfolk
Use this record as a planning anchor for local-first research and nearby weekend-rest discovery, verifying access, transport, and seasonal context with official sources.
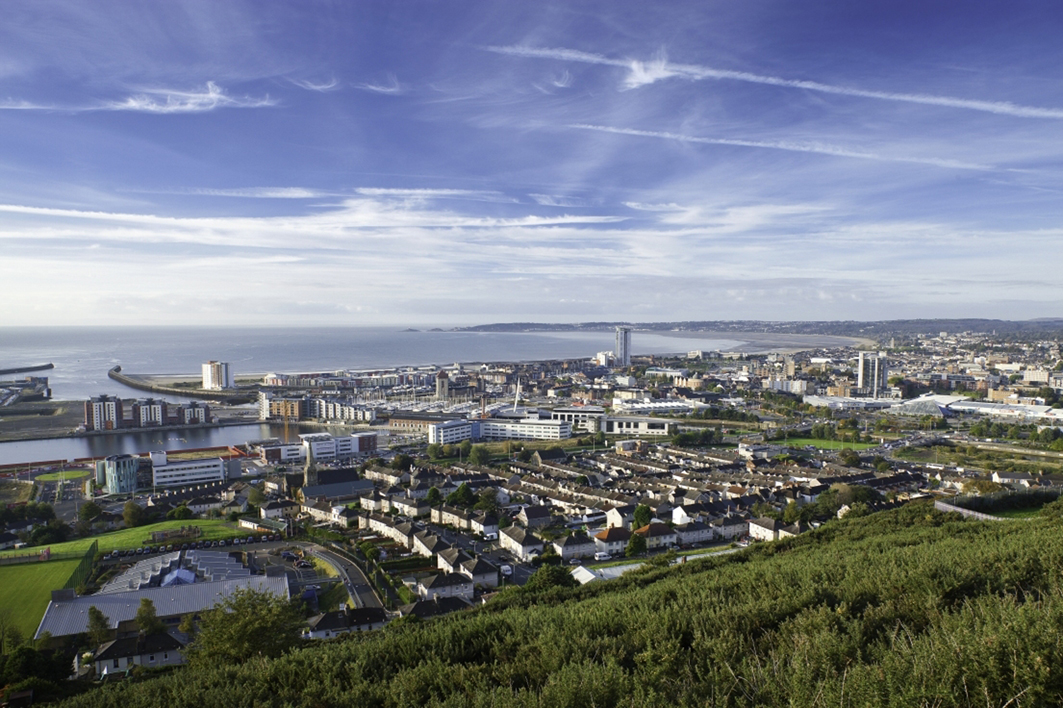
Image credit: Image: Numero007 / Wikimedia Commons, CC BY-SA 4.0
United Kingdom / Wales
Use this record as a planning anchor for local-first research and nearby weekend-rest discovery, verifying access, transport, and seasonal context with official sources.

Image credit: Image: Northlimitation / Wikimedia Commons, Public domain
United Kingdom / Scottish Highlands
Use this record as a planning anchor for local-first research and nearby weekend-rest discovery, verifying access, transport, and seasonal context with official sources.
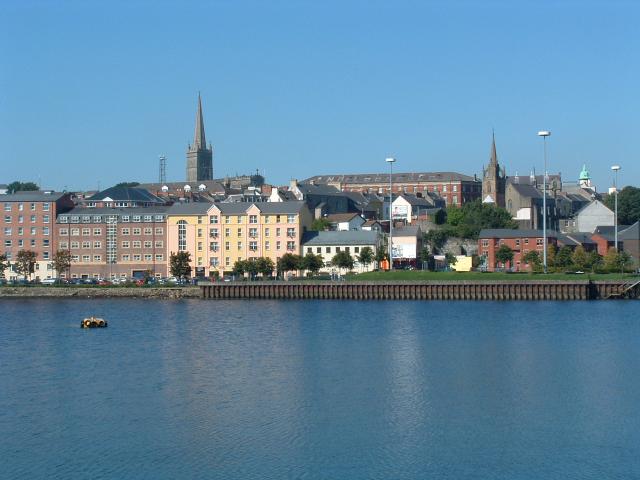
Image credit: Image: Michael Parry / Wikimedia Commons, CC BY-SA 2.0
United Kingdom / Northern Ireland
Use this record as a planning anchor for local-first research and nearby weekend-rest discovery, verifying access, transport, and seasonal context with official sources.

Image credit: Image: No machine-readable author provided. Jungpionier assumed (based on copyright claims). / Wikimedia Commons, CC BY-SA 3.0
United Kingdom / County Durham, England
As a planning anchor, Durham suits local-first research and nearby weekend-rest discovery, with rail links, transport and seasonal details best confirmed through official sources.

Image credit: Image: Lupin at English Wikipedia / Wikimedia Commons, CC BY-SA 3.0
United Kingdom / Lancashire, England
Lancaster serves as a planning anchor for local-first research and nearby weekend-rest discovery, with transport links and seasonal access details worth verifying through official sources.

Image credit: Image: Alex / Wikimedia Commons, CC BY-SA 2.0
United Kingdom / Cumbria, England
As a planning anchor, Carlisle suits local-first research and nearby weekend-rest discovery, with rail connections, transport and seasonal access details best checked through official sources.

Image credit: Image: Chris McKenna (user:Thryduulf) / Wikimedia Commons, CC BY-SA 4.0
United Kingdom / Lincolnshire, England
Treat Lincoln as a planning anchor for local-first research and nearby weekend-rest discovery, verifying access, transport, and seasonal opening details with official sources before travelling.

Image credit: Image: User:Imagaril / Wikimedia Commons, Public domain
United Kingdom / East Riding of Yorkshire, England
Use Hull as a planning anchor for local-first research and nearby weekend-rest discovery, confirming access, transport links, and seasonal details with official sources.

Image credit: Image: Ian S / Wikimedia Commons, CC BY-SA 2.0
United Kingdom / Staffordshire, England
Approach Stoke-on-Trent as a planning anchor for local-first research and nearby weekend-rest discovery, checking access, transport, and seasonal details with official sources.

Image credit: Image: Tim Green / Wikimedia Commons, CC BY 2.0
United Kingdom / Cornwall, England
Consider Truro a planning anchor for local-first research and nearby weekend-rest discovery, verifying access, transport, tide, and seasonal details with official sources.
Source-attributed country-level indicators for United Kingdom, drawn from the World Bank Development Indicators. Use the cards and table together to compare scale, unit, and data year for each metric.
Country-level, not city-level
Indicators describe national context. Pair them with city profiles, comparisons, and verified utility layers (emergency, healthcare, transport) for local detail.
Source-attributed where available
Values come from the World Bank Development Indicators. Where no verified record exists, the platform shows a transparent fallback rather than a guessed number.
Different indicators, different years
Each record carries its own data year because publishers refresh indicators on their own cadence. The card and table both display the year alongside the value.
Context, not a ranking
Treat indicators as orientation, not as a leaderboard. The platform never claims any country is best, safest, cleanest, richest, healthiest, or most connected.
Read alongside city intelligence
Country indicators are most useful when combined with the city profiles in the country, the public-safety, healthcare, and transport sections, and the methodology and data-sources pages.
For full construction details, read the methodology page and the data sources registry.
National-level economic signals to read alongside city-level cost and services pages.
GDP per capita
VerifiedEconomic context only — not a cost-of-living score or a household-income measure.
Data year 2024 updated 2026-04-08
Unemployment rate
VerifiedModeled ILO labor-market context — not a guarantee of job availability for any specific worker.
Data year 2025 updated 2026-04-08
National scale and urbanisation context; pair with city profiles for local detail.
Population
VerifiedNational scale only — not a city population value or a measure of urban density.
Data year 2024 updated 2026-04-08
Urban population share
VerifiedShare of population living in urban areas — not a quality-of-life or urban-form measure.
Data year 2024 updated 2026-04-08
Connectivity context drawn from World Bank usage and subscription indicators.
Internet usage
VerifiedShare of population that uses the internet — not a measure of connection speed or quality.
Data year 2024 updated 2026-04-08
Fixed broadband subscriptions
VerifiedFixed broadband subscriptions per 100 people — not a measure of overall internet quality or speed.
Data year 2024 updated 2026-04-08
National health-system context; not a substitute for verified city-level healthcare layers.
Life expectancy
VerifiedNational health-context indicator — not individual health guidance.
Data year 2024 updated 2026-04-08
Health expenditure per capita
VerifiedPer-capita spending context — not a measure of healthcare quality or access for any individual.
Data year 2024 updated 2026-04-08
National emissions context; read separately from city-level air-quality data.
CO₂ emissions per capita
VerifiedNational emissions context — not a city-level air-quality measurement.
Data year 2024 updated 2026-04-08
| Indicator | Value | Unit | Data year | Status |
|---|---|---|---|---|
| Population | 69,226,000 | people | 2024 | Verified |
| Internet usage | 95.47 | percent | 2024 | Verified |
| Urban population share | 83.24 | percent | 2024 | Verified |
| GDP per capita | 53,246.37 | current US$ | 2024 | Verified |
| Life expectancy | 81.39 | years | 2024 | Verified |
| Health expenditure per capita | 5,860.24 | current US$ | 2024 | Verified |
| Unemployment rate | 4.75 | percent | 2025 | Verified |
| CO₂ emissions per capita | 4.22 | metric tons per capita | 2024 | Verified |
| Fixed broadband subscriptions | 42.16 | per 100 people | 2024 | Verified |
Global City Intelligence — country indicators dataset
VerifiedCountry indicator values appear in this section only after they are sourced from accepted publishers and validated at build time. Malformed records cannot ship to production.
Verified emergency contacts for United Kingdom, drawn from official emergency services and government publishers. Use these as a starting point and confirm current details with local authorities before traveling or relocating.
| Service | Number | Notes |
|---|---|---|
| Universal emergency | 99924/7 | 999 is the primary UK emergency number; 112 also connects to the same service from any phone. |
Each emergency contact above is attributed to an official emergency service or government publisher. Confirm current numbers directly with these sources.
Used as the primary attribution for the EU-wide 112 universal emergency number on European country profiles.
Last verified: 2026-05-16
Methodology and the wider source registry are documented on the scoring methodology and data sources pages.
Verified national healthcare information for United Kingdom, drawn from official government and public health publishers. This is informational only and does not provide medical advice.
Healthcare system
Publicly funded National Health Service (NHS), free at the point of use for residents.
Official health portal
Public health authority
Emergency medical information
Call 999 for medical emergencies. NHS 111 provides non-emergency medical advice in England, Scotland, and Wales.
Insurance and access
Most NHS services are free at the point of use for residents; visitors should consult NHS guidance on charges.
Official hospital registry
NHS England service finder for locating hospitals and other NHS services by postcode.
Last verified: 2026-05-16
Each entry above is attributed to an official government, public health, or recognised health-system publisher. Confirm current information directly with these sources.
Used as the primary attribution for United Kingdom public-health and hospital information.
Used as the official England hospital registry reference for verified facility lookups.
Last verified: 2026-05-16
Related sections: emergency and public safety, scoring methodology, and data sources.
Verified national transport context for United Kingdom, attributed to official transport ministries, national operators, and aviation authorities. This is informational only; routes, fares, and schedules change frequently — check the linked authorities for current details.
Public transport overview
The Department for Transport sets national policy; rail infrastructure is operated by Network Rail with multiple passenger operators, and major metropolitan areas have dedicated transport authorities such as Transport for London.
National transport authority
Rail authority or operator
Aviation authority
Each entry above is attributed to an official transport authority, national operator, airport publisher, or government source. Confirm current information directly with these publishers.
Used as the primary attribution for United Kingdom national transport context.
Used as the primary attribution for United Kingdom aviation authority information.
Used as the primary attribution for Great Britain rail infrastructure information.
Last verified: 2026-05-16
Related sections: emergency and public safety, healthcare and hospitals, cities directory, countries directory, scoring methodology, data sources.
Curated city-vs-city comparisons that include at least one city from United Kingdom. Each link opens a comparison page with structured indicators across cost, safety, healthcare, transport, and country context.
Europe · Quality of life
London vs Paris: Cost, Safety, Healthcare & Transport
Compare London and Paris across cost of living, air quality, safety, healthcare, transport, emergency services, and country context to support relocation, remote work, and travel planning.
Europe · Relocation
Dublin vs Edinburgh: Cost, Safety, Healthcare & Transport
Compare Dublin and Edinburgh across cost of living, air quality, safety, healthcare, transport, and country context for English-speaking European relocation.
Global · Global hub comparison
New York vs London: Cost, Safety, Healthcare & Transport
Compare New York and London across cost of living, air quality, safety, healthcare, transport, and country context for users evaluating the world's two largest English-language financial hubs.
Europe · Relocation
Berlin vs London: Cost, Safety, Healthcare & Transport
Compare Berlin and London across cost of living, air quality, safety, healthcare, transport, and country context for users weighing European relocation between EU and UK contexts.
Europe · Regional alternative
Manchester vs Birmingham: Cost, Safety, Healthcare & Transport
Compare Manchester and Birmingham as English regional cores through structured city indicators, country context, verified media, and methodology notes. Use this comparison as a directional planning view, not an official ranking.
Europe · Regional alternative
Manchester vs Leeds: Cost, Safety, Healthcare & Transport
Pair Manchester and Leeds for a Northern-England comparison across cost framing, transport access, healthcare and emergency context, and country-level indicators.
Europe · Regional alternative
Manchester vs Glasgow: Cost, Safety, Healthcare & Transport
Review Manchester and Glasgow side by side across cost framing, transport access, and country-level public-service context for UK cross-region relocation planning.
Europe · Regional alternative
Birmingham vs Bristol: Cost, Safety, Healthcare & Transport
Compare Birmingham and Bristol across cost framing, transport access, and country-level intelligence for users weighing two English regional metros.
Europe · Regional alternative
Glasgow vs Edinburgh: Cost, Safety, Healthcare & Transport
Pair Glasgow and Edinburgh for a Scottish intra-country comparison across cost framing, transport access, healthcare context, and country-level indicators.
Europe · Regional alternative
Cardiff vs Bristol: Cost, Safety, Healthcare & Transport
Compare Cardiff and Bristol as adjacent Severn-corridor metros across cost framing, transport access, and country-level public-service context.
Europe · Relocation
Belfast vs Dublin: Cost, Safety, Healthcare & Transport
Pair Belfast and Dublin for a cross-border Ireland comparison across cost framing, transport access, healthcare context, and country-level intelligence — useful for English-speaking European relocation review.
Curated city collections that include at least one United Kingdom city. Each collection is a comparison-oriented shortlist, not an official ranking.
Startups
Compare cities with startup and business relevance through connectivity, infrastructure, transport, and international hub positioning. A curated shortlist, not an official ranking.
1 city from United Kingdom in this collection
Public transport
A mobility-focused city collection comparing cities with useful public-transport context and verified transport or mobility profiles where available.
1 city from United Kingdom in this collection
Explore rankings where supported United Kingdom city profiles appear. Use rankings as directional city intelligence, not an official government ranking.
Ranking
A balanced ranking of cities across affordability, air quality, clean-energy readiness, and resilience.
55 cities from United Kingdom appears in this ranking
Ranking
Cities that combine strong services, mobility, safety, clean air, and resilience into a healthy day-to-day profile.
55 cities from United Kingdom appears in this ranking
Ranking
Cities that combine fast connectivity, safety, healthy day-to-day life, and a manageable cost-of-living balance for remote and hybrid workers.
55 cities from United Kingdom appears in this ranking
Ranking
A health-oriented comparison of city air-quality scores using WHO-centered pollutant interpretation.
55 cities from United Kingdom appears in this ranking
Ranking
Cities ranked by cost-of-living score, weighing housing pressure, essential spending, and household offsets across global metros.
55 cities from United Kingdom appears in this ranking
Ranking
Cities ranked by internet speed, mobile coverage, and digital-readiness depth for residents, businesses, and remote workers.
55 cities from United Kingdom appears in this ranking
Ranking
A ranking of city energy-transition readiness, grid resilience, clean-resource potential, and adaptation capacity.
55 cities from United Kingdom appears in this ranking
Ranking
A practical affordability ranking that weighs housing pressure against transport access, services, and opportunity density.
55 cities from United Kingdom appears in this ranking
See the full rankings directory for every available structured ranking.
Across 55 indexed cities, London leads at 85/100 and Truro sits at 50/100. Use the country page as a parent context layer; module-level detail lives on each city profile. Data year 2025; last updated 2026-05-16. Drawn from 5 institutional references.
Structured indicators on this hub are directional and intended for orientation. Verified utility layers — emergency, healthcare, transport — are attributed to official publishers where available and use transparent fallback states where verified country-level data is not yet integrated.
Structured indicators on this page are directional and intended for orientation. Verified datasets are being integrated; official sources should be used for critical decisions.
5 institutional references inform this view, listed below with reliability notes. Structured indicators on this page are directional and intended for orientation; verified datasets are being integrated and official sources should be used for critical decisions.
Used as a policy and methodology reference for urban exposure and resilience signals.
Used as an energy-resource and weather-normalization reference.
Used where European city comparisons need monitored air-quality context.
Used to explain urban climate vulnerability and adaptation scoring logic.
Used as the connectivity reference for national and city-level digital-readiness signals.